Fig. 6

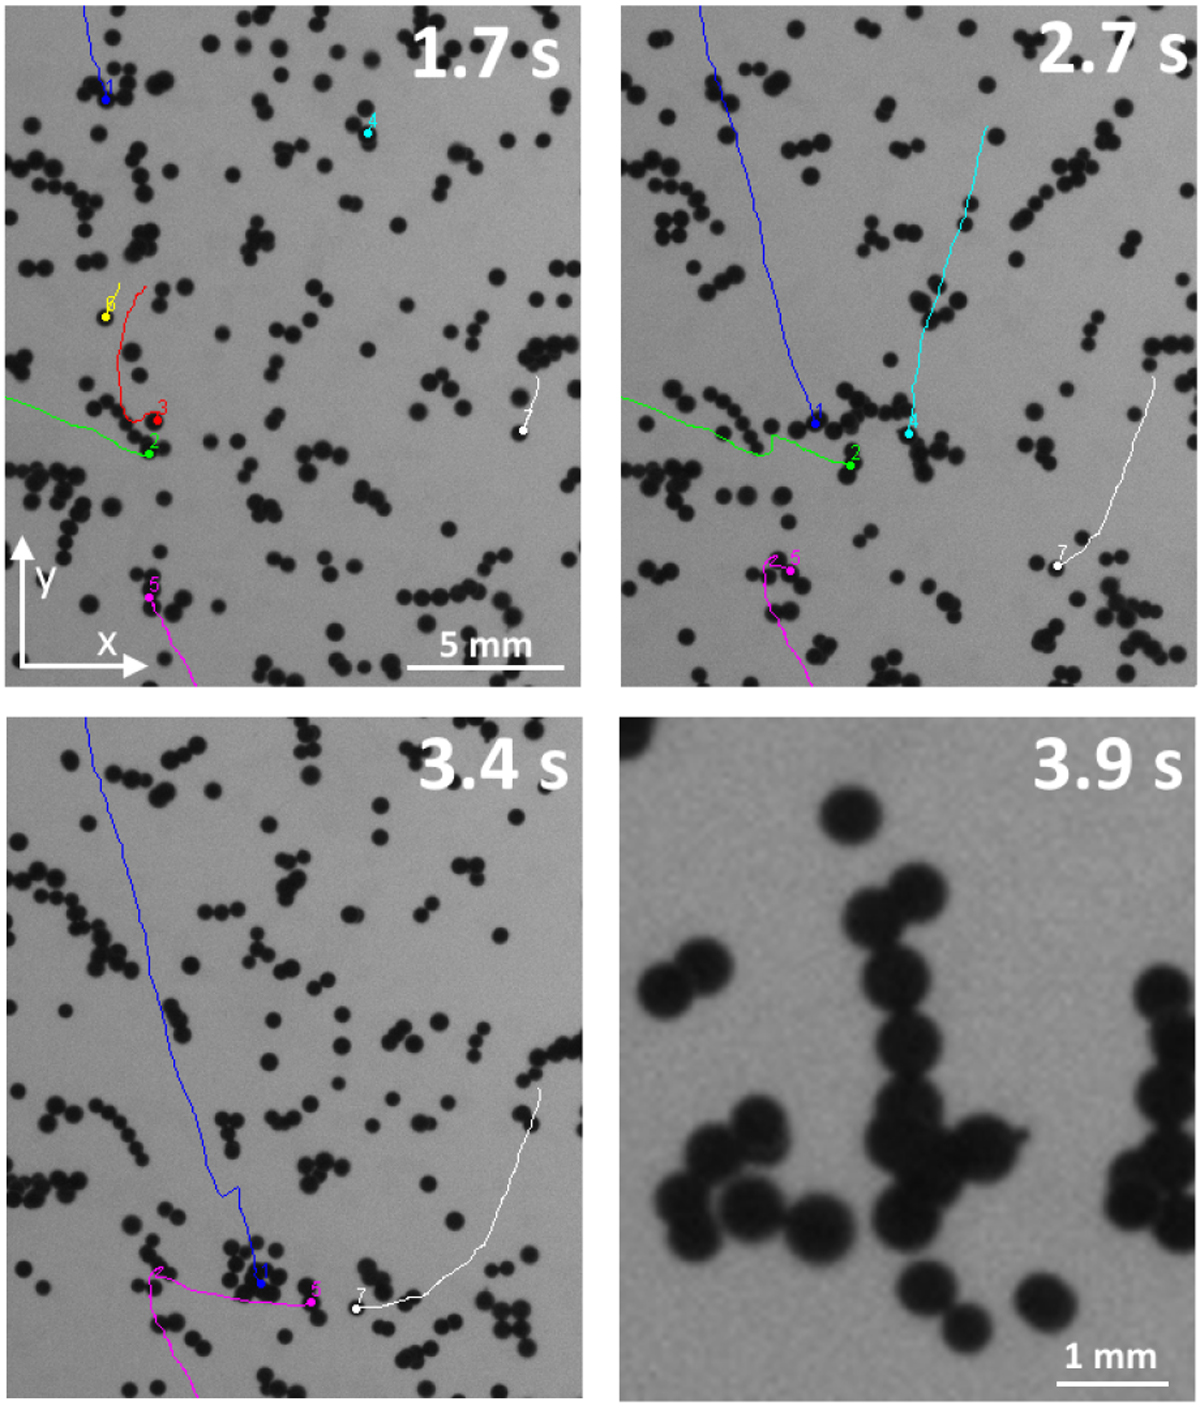
Largest cluster observed consisting of ten particles (bottom-right image). The other three images of this figure show part of the formation history of this cluster. The coloured lines are trajectories of individual grains or smaller clusters that collide, stick together, and form larger clusters. These clusters collide further and become the large cluster, eventually. The time inthe top right corner of each image shows the elapsed time after the beginning of the first trajectory. The final large cluster is formed of two trimers (cluster consisting of three individual grains) and one quad (cluster with four grains). After a collision, only one of the two trajectories is continued. For the first trimer, sequential growth is observed (1+1+1). Afterwards, it collides and sticks to the other trimer. This second trimer grew somewhere else which is not shown in the images. The quad is observed to form from 2+1+1 particles. It then combines with the two trimers. The final cluster is shown after 3.9 s in higher resolution.
Current usage metrics show cumulative count of Article Views (full-text article views including HTML views, PDF and ePub downloads, according to the available data) and Abstracts Views on Vision4Press platform.
Data correspond to usage on the plateform after 2015. The current usage metrics is available 48-96 hours after online publication and is updated daily on week days.
Initial download of the metrics may take a while.


