Fig. 9.
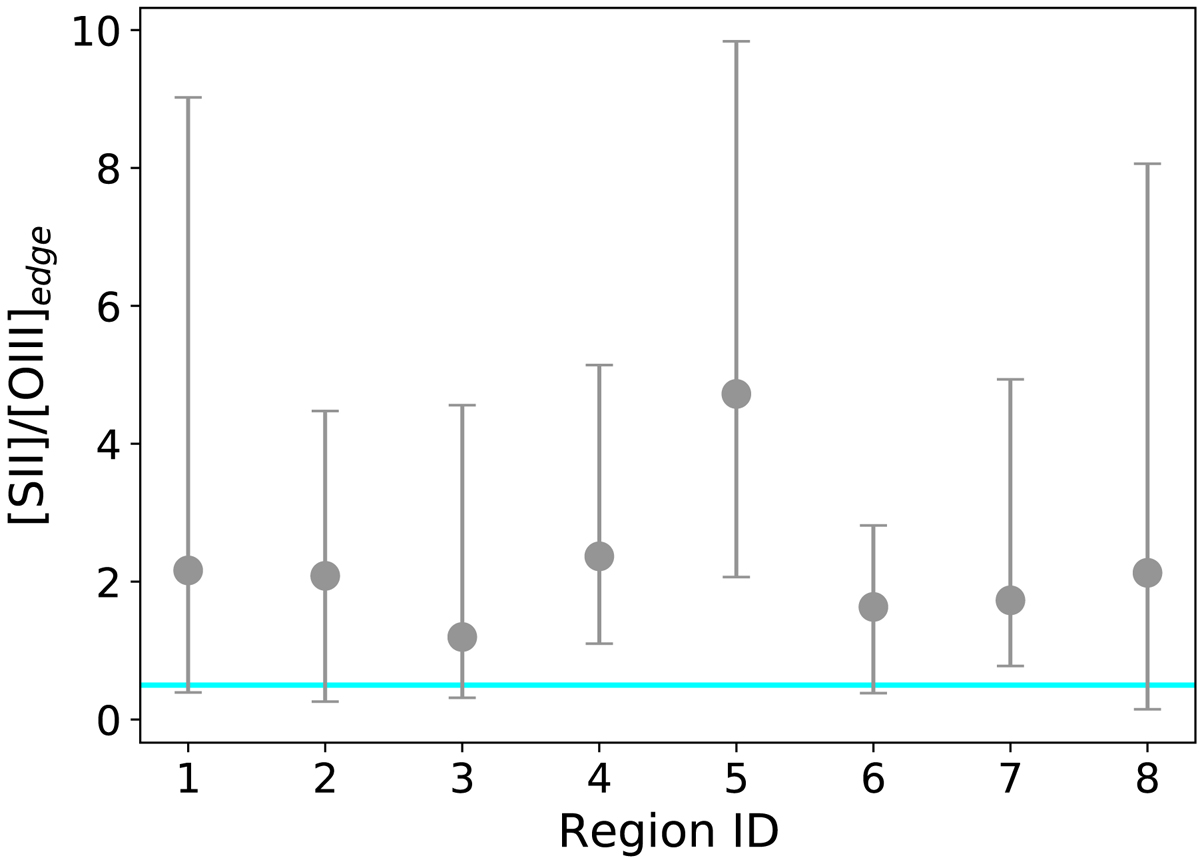
Values of [S II]6716,31/[O III]4959,5007 along the contour of the H II regions labelled in Fig. 8. The solid points and error bars show, respectively, the median and the range in values spanned by the ratio. The cyan line indicates a ratio of 0.5, which we use as fiducial limit for the transition to optically thick gas. Regions for which the range in [S II]/[O III] extends below this limit are classified as featuring optically thin channels (CH); all other regions are classified as ionisation bounded (IB).
Current usage metrics show cumulative count of Article Views (full-text article views including HTML views, PDF and ePub downloads, according to the available data) and Abstracts Views on Vision4Press platform.
Data correspond to usage on the plateform after 2015. The current usage metrics is available 48-96 hours after online publication and is updated daily on week days.
Initial download of the metrics may take a while.