Fig. 8.
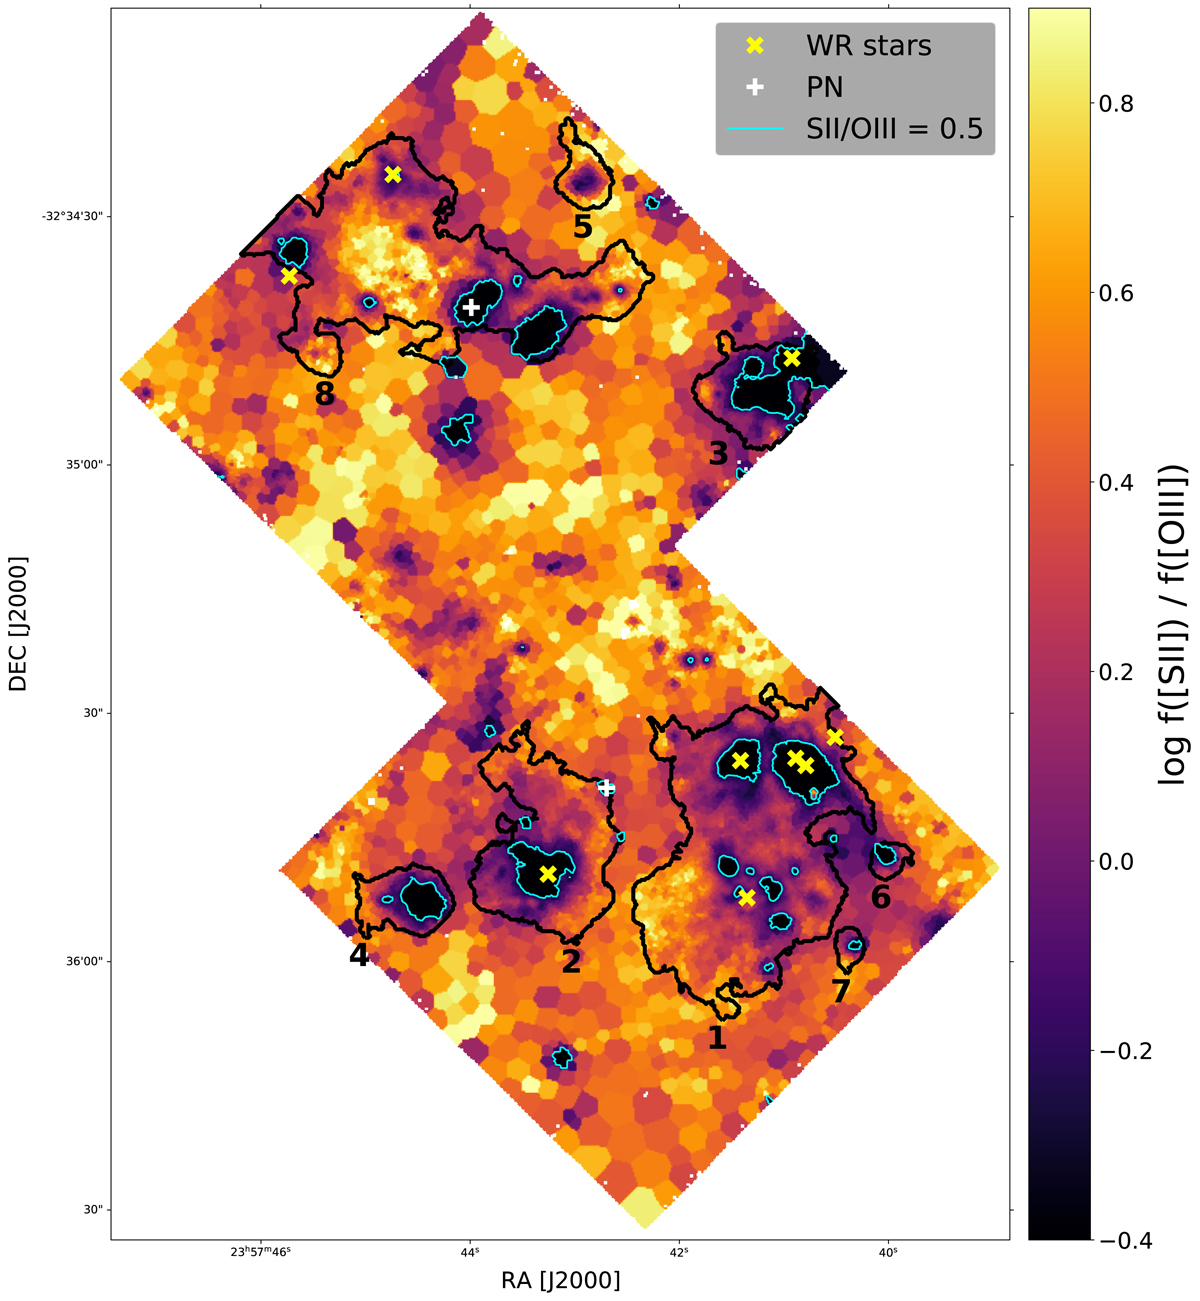
[S II]6716,31/[O III]4959,5007 ratio map (reddening corrected), tracing the ionisation structure of the gas. The cyan contours indicate a ratio of 0.5, which we use as fiducial limit for the transition to optically thick gas. Numbered black contours correspond to the H II regions analysed in Sect. 7. The position of WR stars (yellow crosses) and planetary nebulae (white plus symbols) is also indicated.
Current usage metrics show cumulative count of Article Views (full-text article views including HTML views, PDF and ePub downloads, according to the available data) and Abstracts Views on Vision4Press platform.
Data correspond to usage on the plateform after 2015. The current usage metrics is available 48-96 hours after online publication and is updated daily on week days.
Initial download of the metrics may take a while.