Fig. 5.
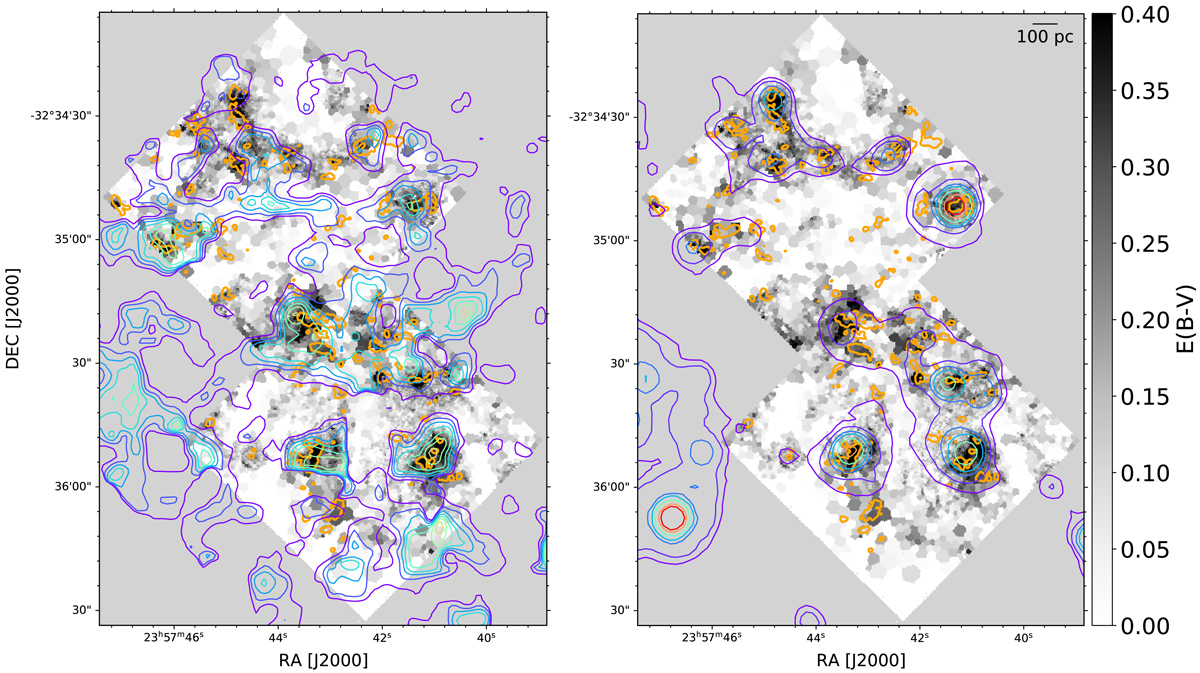
Extinction map derived from the ionised gas observed with MUSE assuming an intrinsic Hα/Hβ ratio (from Paper I) compared to: Left panel: contours of the extinction map derived by Kahre et al. (2018) from the individual stellar extinctions obtained from HST data. The contours correspond to values of E(B − V) = 0.2 − 0.5, in steps of 0.033. Right panel: 24 μm emission from Spitzer/MIPS. The contours correspond to a flux of [1.5, 2, 3, 4, 6, 9, 11] MJy sr−1. The thick orange contours indicate the position of GMCs.
Current usage metrics show cumulative count of Article Views (full-text article views including HTML views, PDF and ePub downloads, according to the available data) and Abstracts Views on Vision4Press platform.
Data correspond to usage on the plateform after 2015. The current usage metrics is available 48-96 hours after online publication and is updated daily on week days.
Initial download of the metrics may take a while.