Fig. 2.
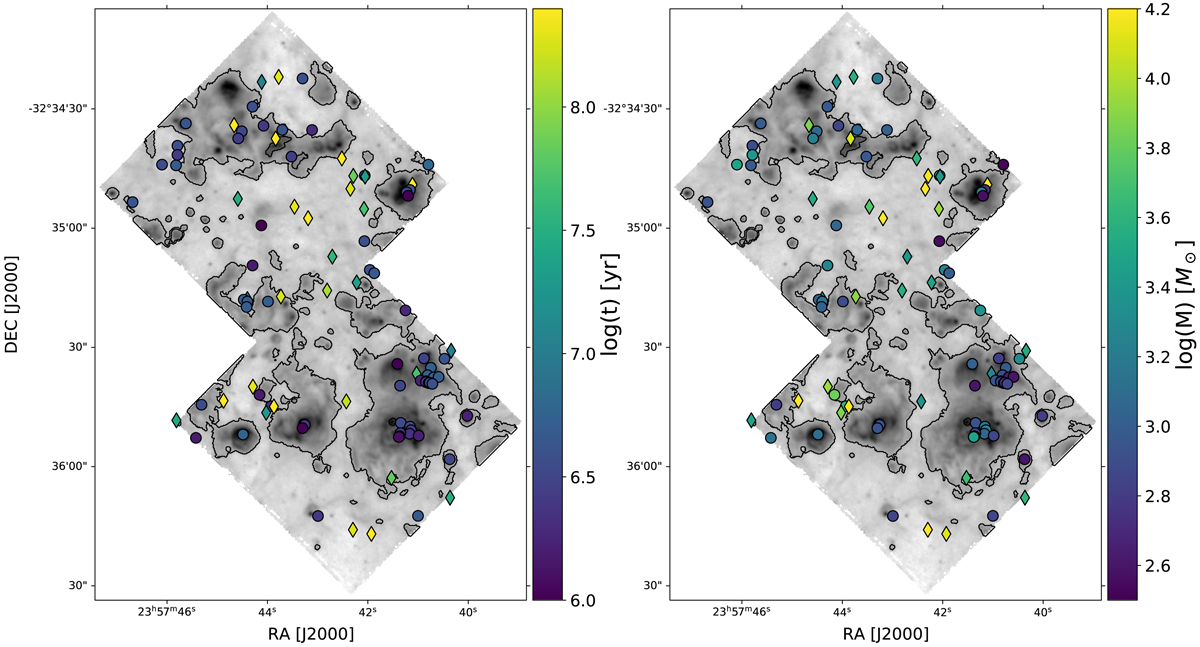
Spatial distribution of YSC ages (left panel) and masses (right panel) in the MUSE FoV, overlaid on the Hα map shown in Fig. 1. Circles and diamonds indicate, respectively, clusters younger and older than 10 Myr. Ages and masses are best estimates computed from the median of the corresponding PDF (see Sect. 3.2). Black contours indicate the H II regions identified in Paper I.
Current usage metrics show cumulative count of Article Views (full-text article views including HTML views, PDF and ePub downloads, according to the available data) and Abstracts Views on Vision4Press platform.
Data correspond to usage on the plateform after 2015. The current usage metrics is available 48-96 hours after online publication and is updated daily on week days.
Initial download of the metrics may take a while.