Fig. 11.
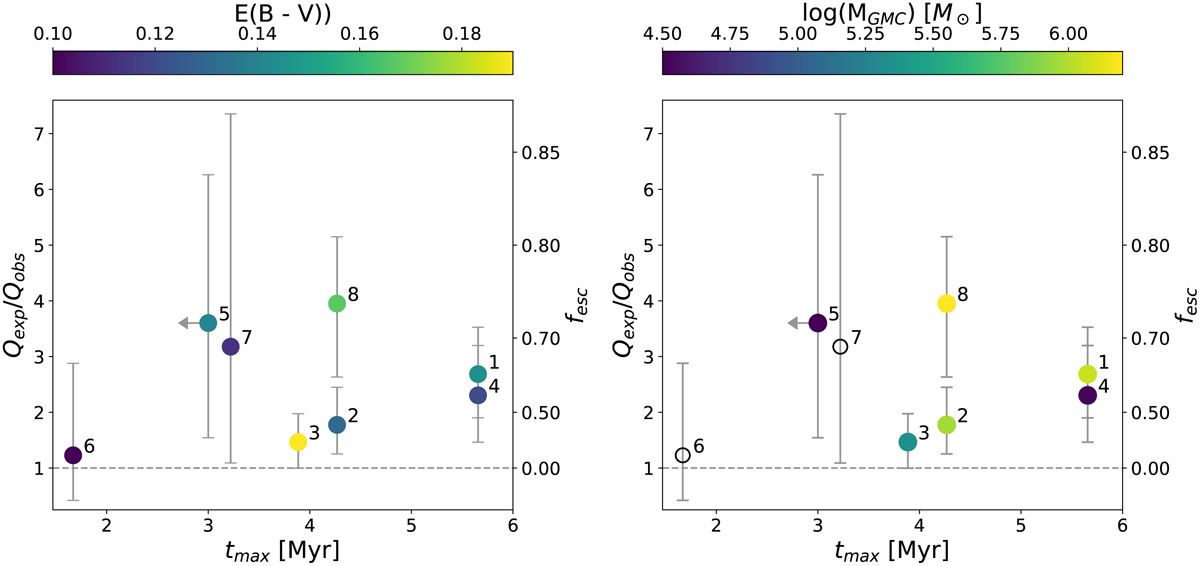
Ratio of expected to observed ionising photon flux Q(H0) for the regions labelled in Fig. 8, versus the age of the oldest cluster in each region (best-value estimate obtained from the median of the age PDF; masking cluster with ages > 10 Myr). For region 5, which is hosting exclusively O stars, we assume an upper limit of 3 Myr for the age. The dashed horizontal line indicates an fesc = 0. Left panel: points are colour-coded according to the median E(B − V) in each region (Balmer decrement estimate). Right panel: regions are colour-coded according to their total GMC mass. Empty black circles indicate regions hosting no GMCs.
Current usage metrics show cumulative count of Article Views (full-text article views including HTML views, PDF and ePub downloads, according to the available data) and Abstracts Views on Vision4Press platform.
Data correspond to usage on the plateform after 2015. The current usage metrics is available 48-96 hours after online publication and is updated daily on week days.
Initial download of the metrics may take a while.