Fig. 1.
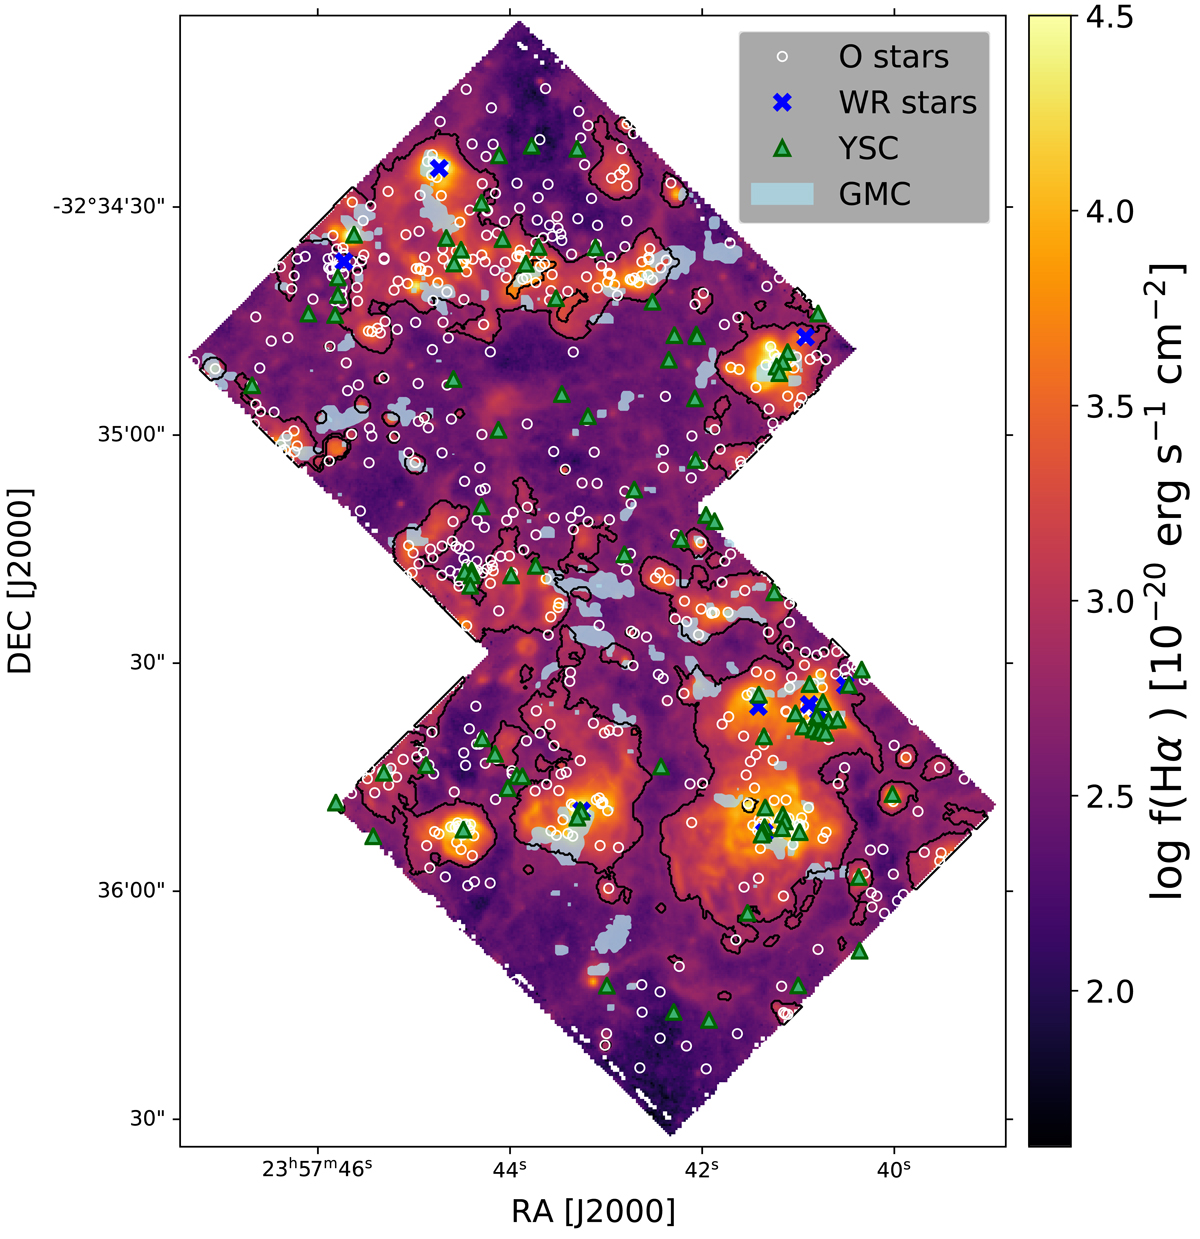
Stellar census in the MUSE FoV. The location of candidate O stars (white circles), YSCs (green triangles) and WR stars (blue crosses) is indicated, overlaid on a map of the Hα emission. Black contours indicate the H II regions identified in Paper I, light blue filled contours denote the position of GMCs.
Current usage metrics show cumulative count of Article Views (full-text article views including HTML views, PDF and ePub downloads, according to the available data) and Abstracts Views on Vision4Press platform.
Data correspond to usage on the plateform after 2015. The current usage metrics is available 48-96 hours after online publication and is updated daily on week days.
Initial download of the metrics may take a while.