Fig. A.1
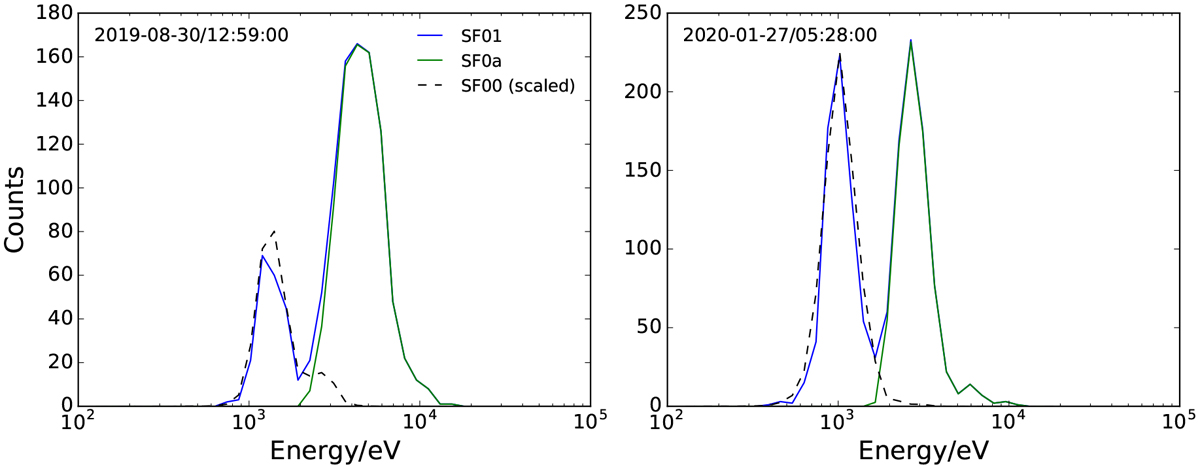
Examples of counts versus energy per charge spectra during E03 (left plot) and E04 (right plot) from SPAN-Ion’s SF01 (alpha particle) channel. Blue lines are the raw spectra, illustrating anomalous proton counts at low energies; dashed lines are SF00 proton counts scaled down to match the height of the lower energy peak; and green lines represent the corrected counts after applying our subtraction method.
Current usage metrics show cumulative count of Article Views (full-text article views including HTML views, PDF and ePub downloads, according to the available data) and Abstracts Views on Vision4Press platform.
Data correspond to usage on the plateform after 2015. The current usage metrics is available 48-96 hours after online publication and is updated daily on week days.
Initial download of the metrics may take a while.