Fig. 9.
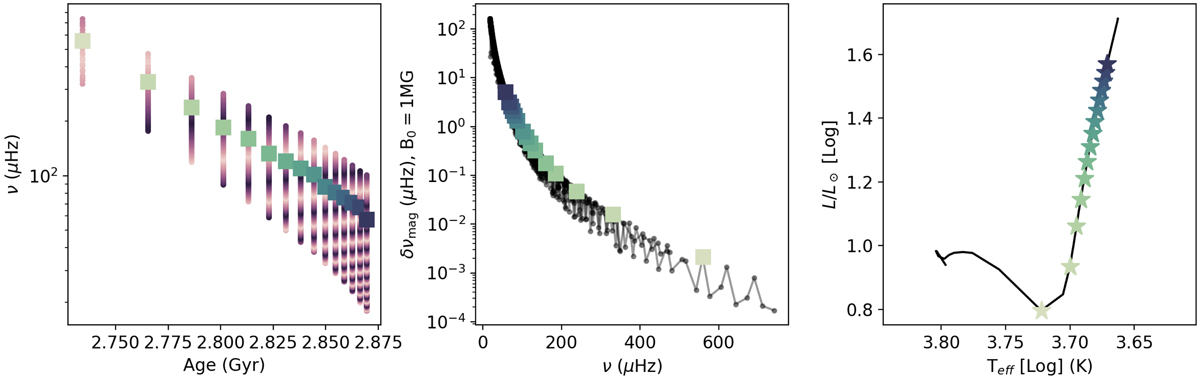
Left: mixed-mode frequencies at different evolutionary stages along the RGB indicated in the right panel. Purple dots represent the individual frequencies of mixed modes, with the shade of the dots allowing to visualise the evolution of the mixed-mode order npg (the order is higher at high frequencies). Squares represent for each evolutionary stage the frequency of the ℓ = 1 g-dominated mode closest to νmax (see Fig. 10 for the determination of this frequency). Middle: m = 1 magnetic splitting of ℓ = 1 mixed modes located inside [νmax − 7Δν : νmax + 7Δν] for each of the evolutionary stages denoted in the right panel. Squares represent for each evolutionary stage the frequency of the ℓ = 1 g-dominated mode closest to νmax (ν1, g, max, see Fig. 5) Right: Hertzsprung-Russell diagram of the M⋆ = 1.5 M⊙, Z = 0.02 star ascending the RGB. Coloured stars indicate the different evolutionary stages represented in the other panels.
Current usage metrics show cumulative count of Article Views (full-text article views including HTML views, PDF and ePub downloads, according to the available data) and Abstracts Views on Vision4Press platform.
Data correspond to usage on the plateform after 2015. The current usage metrics is available 48-96 hours after online publication and is updated daily on week days.
Initial download of the metrics may take a while.