Fig. B.1.
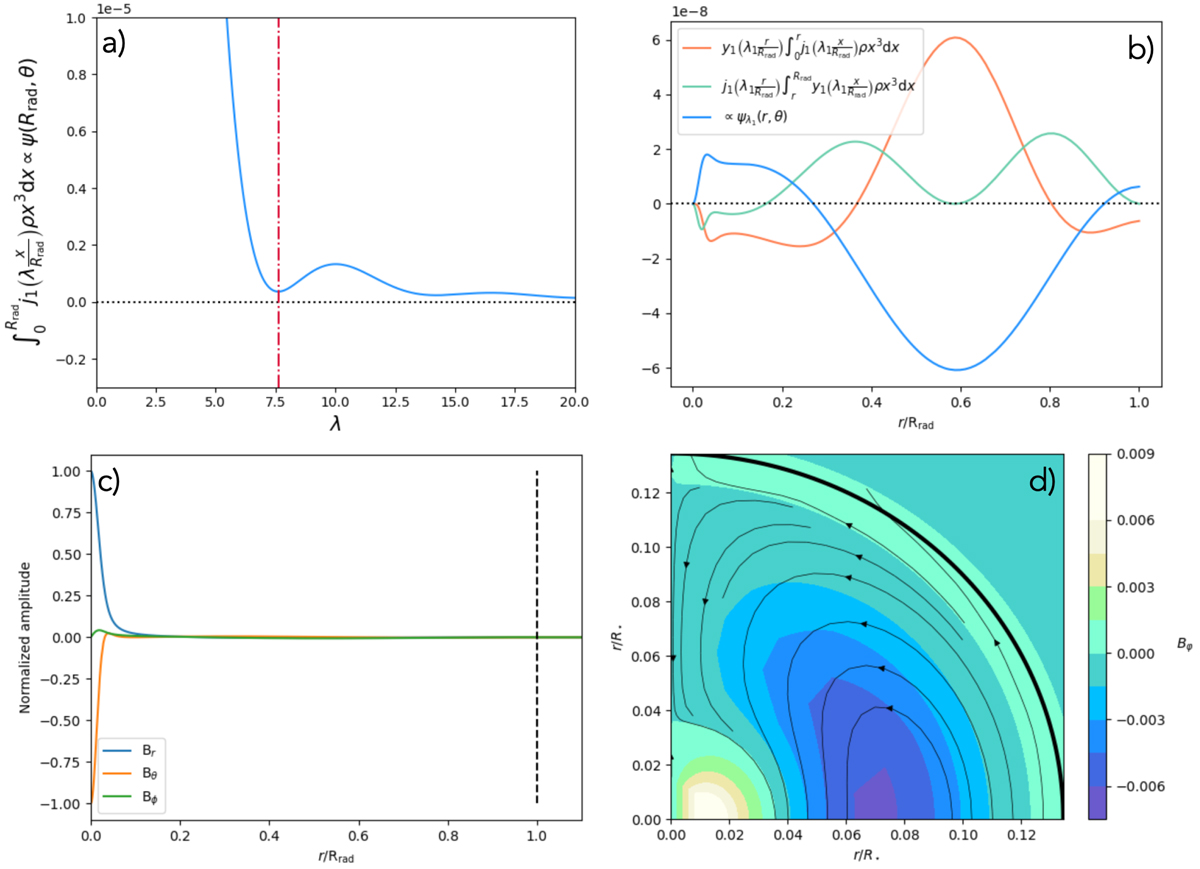
Attempt to find the first zero of ![]() at the radiative–convective boundary. We consider the typical red giant with M = 1.5 M⊙, Z = 0.02 on the RGB. Panel a: trend of the evolution of the ψ function at r = Rrad with the eigenvalue λ. The value λ1 closest to the eigenvalue is indicated by the red vertical line. Panel b: shape of the functions
at the radiative–convective boundary. We consider the typical red giant with M = 1.5 M⊙, Z = 0.02 on the RGB. Panel a: trend of the evolution of the ψ function at r = Rrad with the eigenvalue λ. The value λ1 closest to the eigenvalue is indicated by the red vertical line. Panel b: shape of the functions ![]() ,
, ![]() and ψλ1(r, θ) with λ1 ≃ 7.62, the vertical dashed line indicates the surface. Panel c: magnetic field components with λ1 ≃ 7.62. Panel d: resulting magnetic field topology with λ1 ≃ 7.62.
and ψλ1(r, θ) with λ1 ≃ 7.62, the vertical dashed line indicates the surface. Panel c: magnetic field components with λ1 ≃ 7.62. Panel d: resulting magnetic field topology with λ1 ≃ 7.62.
Current usage metrics show cumulative count of Article Views (full-text article views including HTML views, PDF and ePub downloads, according to the available data) and Abstracts Views on Vision4Press platform.
Data correspond to usage on the plateform after 2015. The current usage metrics is available 48-96 hours after online publication and is updated daily on week days.
Initial download of the metrics may take a while.