Fig. 16.
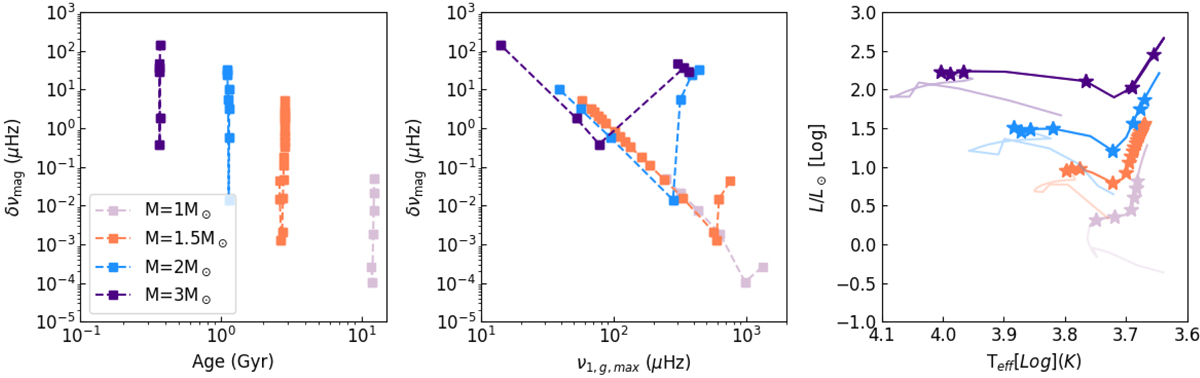
Left: magnetic frequency splitting calculated at the central mode frequency ν1, g, max versus the age of the different evolutionary stages reported in the right panel for Z = 0.02, M⋆ ∈ {1, 1.5, 2, 3} M⊙. Middle: magnetic frequency splitting calculated at the central mode frequency ν1, g, max for the different evolutionary stages and masses reported in the right panel. Right: Hertzsprung-Russell diagram corresponding to the colour-coded Z = 0.02, M⋆ ∈ {1, 1.5, 2, 3} M⊙ stars. The star symbols indicate the position of the star at which measurements are reported in the left and middle panels.
Current usage metrics show cumulative count of Article Views (full-text article views including HTML views, PDF and ePub downloads, according to the available data) and Abstracts Views on Vision4Press platform.
Data correspond to usage on the plateform after 2015. The current usage metrics is available 48-96 hours after online publication and is updated daily on week days.
Initial download of the metrics may take a while.