Fig. 11.
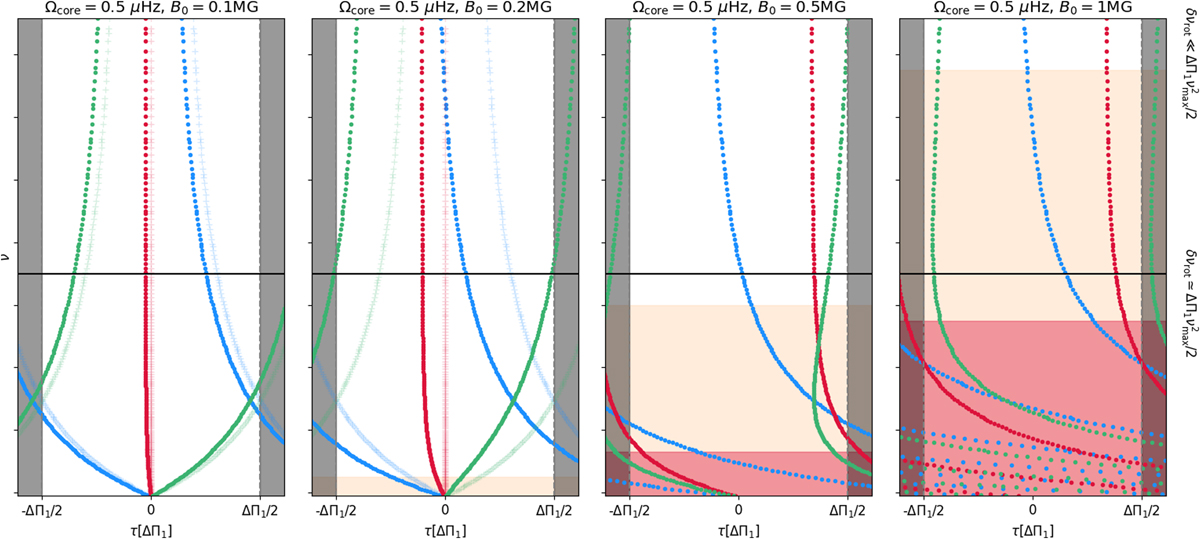
Synthetic stretched period echelle diagram built from Eq. (54), showing modelled mixed-mode frequencies affected by rotation with Ωcore = 0.5 μHz and magnetic-field strengths increasing left to right with B0 = 0.1 MG, B0 = 0.2 MG, B0 = 0.5 MG, and B0 = 1 MG in the radiative interior. Purely rotationally split components are given for reference by background crosses on the first two panels. Coloured dots indicate the positions of the ℓ = 1 mixed modes of azimuthal order m ∈ {1, 0, −1}, respectively blue, red, and green dots. The horizontal black line delimits domains for which the rotational splitting is small compared to ![]() (see Gehan et al. 2018, for more details). Synthetic patterns above this line are typically representative of patterns of mixed modes for subgiants and early giants, and those below are associated with evolved red giants. The magnetic effect is small compared to rotational effects in white areas, is of the same order of magnitude as in orange areas, and is larger than δνrot, core, m in red areas.
(see Gehan et al. 2018, for more details). Synthetic patterns above this line are typically representative of patterns of mixed modes for subgiants and early giants, and those below are associated with evolved red giants. The magnetic effect is small compared to rotational effects in white areas, is of the same order of magnitude as in orange areas, and is larger than δνrot, core, m in red areas.
Current usage metrics show cumulative count of Article Views (full-text article views including HTML views, PDF and ePub downloads, according to the available data) and Abstracts Views on Vision4Press platform.
Data correspond to usage on the plateform after 2015. The current usage metrics is available 48-96 hours after online publication and is updated daily on week days.
Initial download of the metrics may take a while.