Fig. 7
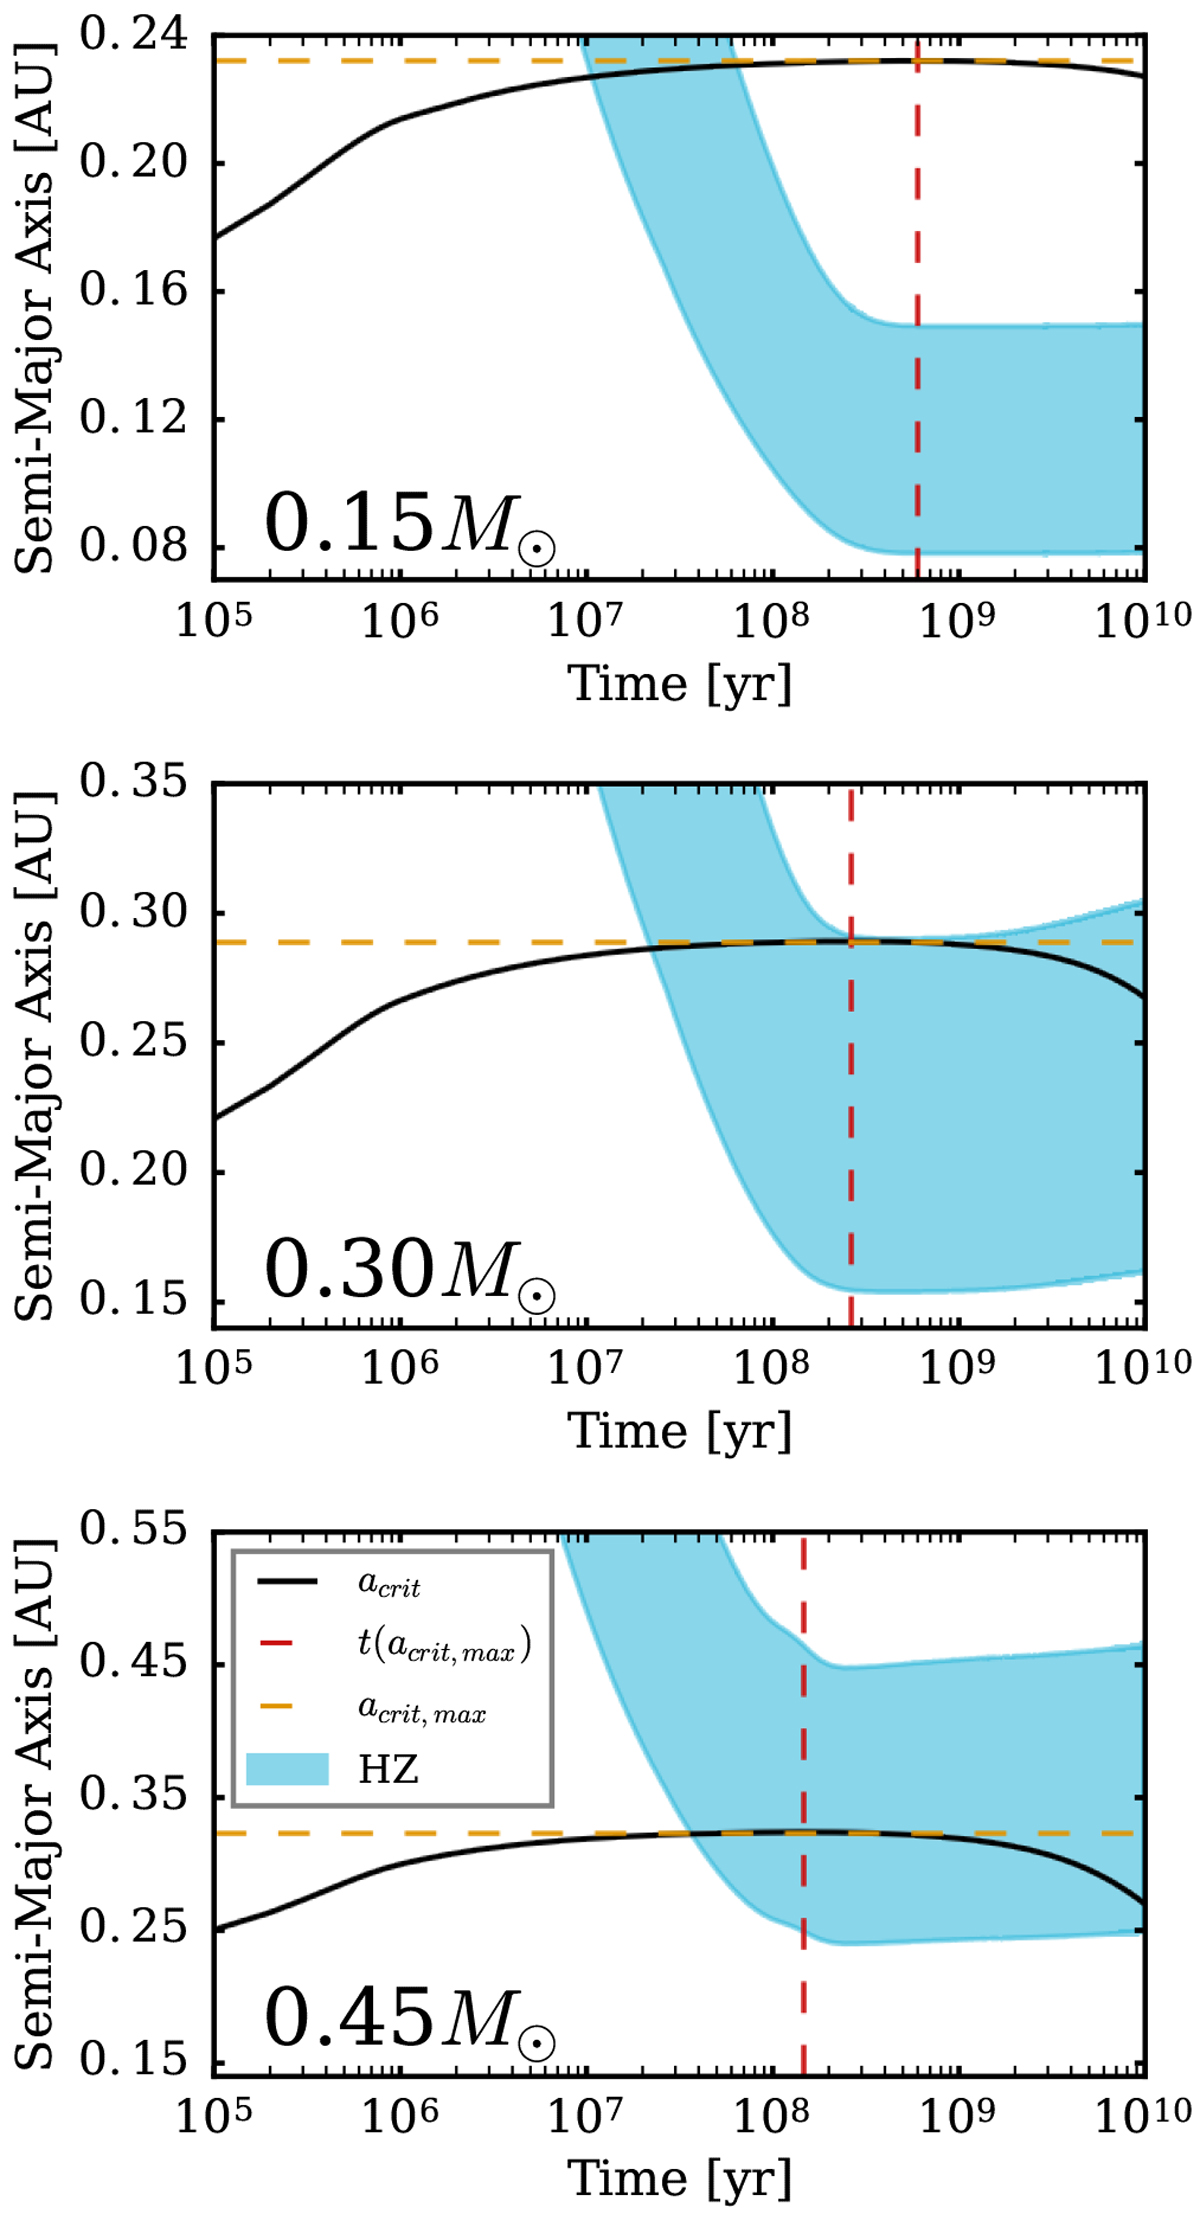
Evolution of acrit and the HZ for three hypothetical equal-mass binaries. The blue shaded region is the HZ; the black curves are the values of acrit ; the dashed horizontal orange lines are the maximum value of acrit; and the dashed vertical red lines are the time that acrit reached its maximum value. Top: stellar masses are 0.15 M⊙. Middle: stellar masses are 0.3 M⊙. Bottom: stellar masses are 0.45 M⊙. The approximate runtime was 6 min in total. github.com: cbp_dynamic_stability/HZ_Evolution/
Current usage metrics show cumulative count of Article Views (full-text article views including HTML views, PDF and ePub downloads, according to the available data) and Abstracts Views on Vision4Press platform.
Data correspond to usage on the plateform after 2015. The current usage metrics is available 48-96 hours after online publication and is updated daily on week days.
Initial download of the metrics may take a while.