Fig. 2
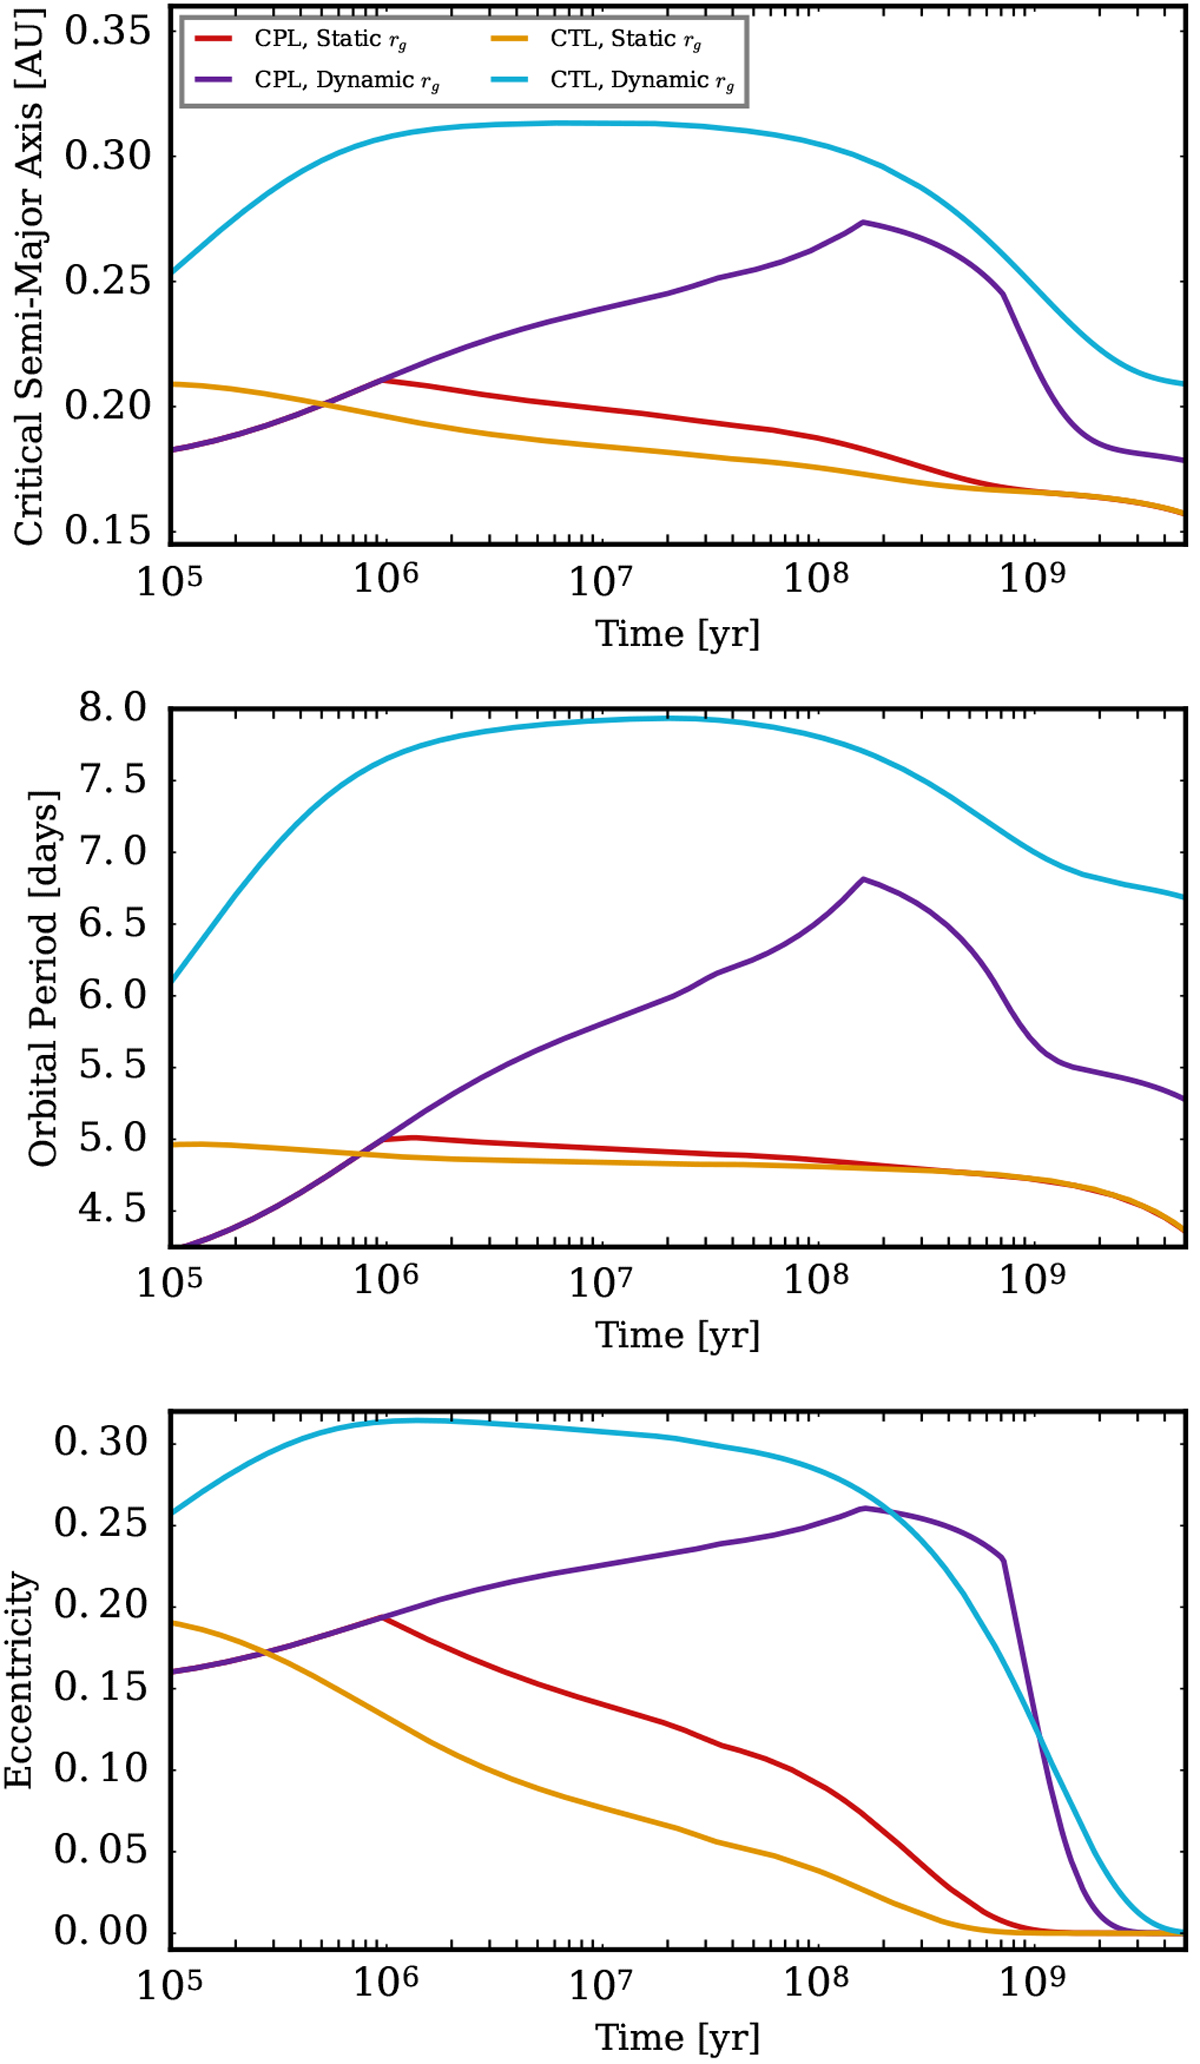
Long-term coupled stellar–tidal evolution of two solar-mass stars for various assumptions. Red curves represent stars that experience the CPL tidal model and constant radius of gyration rg ; purple curves are the CPL with evolving rg; orange curves are the CTL tidal model with constant rg; and pale blue curves are the CTL with evolving rg. Top: evolution of the stability limit acrit. Middle: orbital period of the binary star. Bottom: binary’s orbital eccentricity. The approximate runtime was 40 min in total. github.com: cbp_dynamic_stability/STEEP/
Current usage metrics show cumulative count of Article Views (full-text article views including HTML views, PDF and ePub downloads, according to the available data) and Abstracts Views on Vision4Press platform.
Data correspond to usage on the plateform after 2015. The current usage metrics is available 48-96 hours after online publication and is updated daily on week days.
Initial download of the metrics may take a while.