Fig. 1
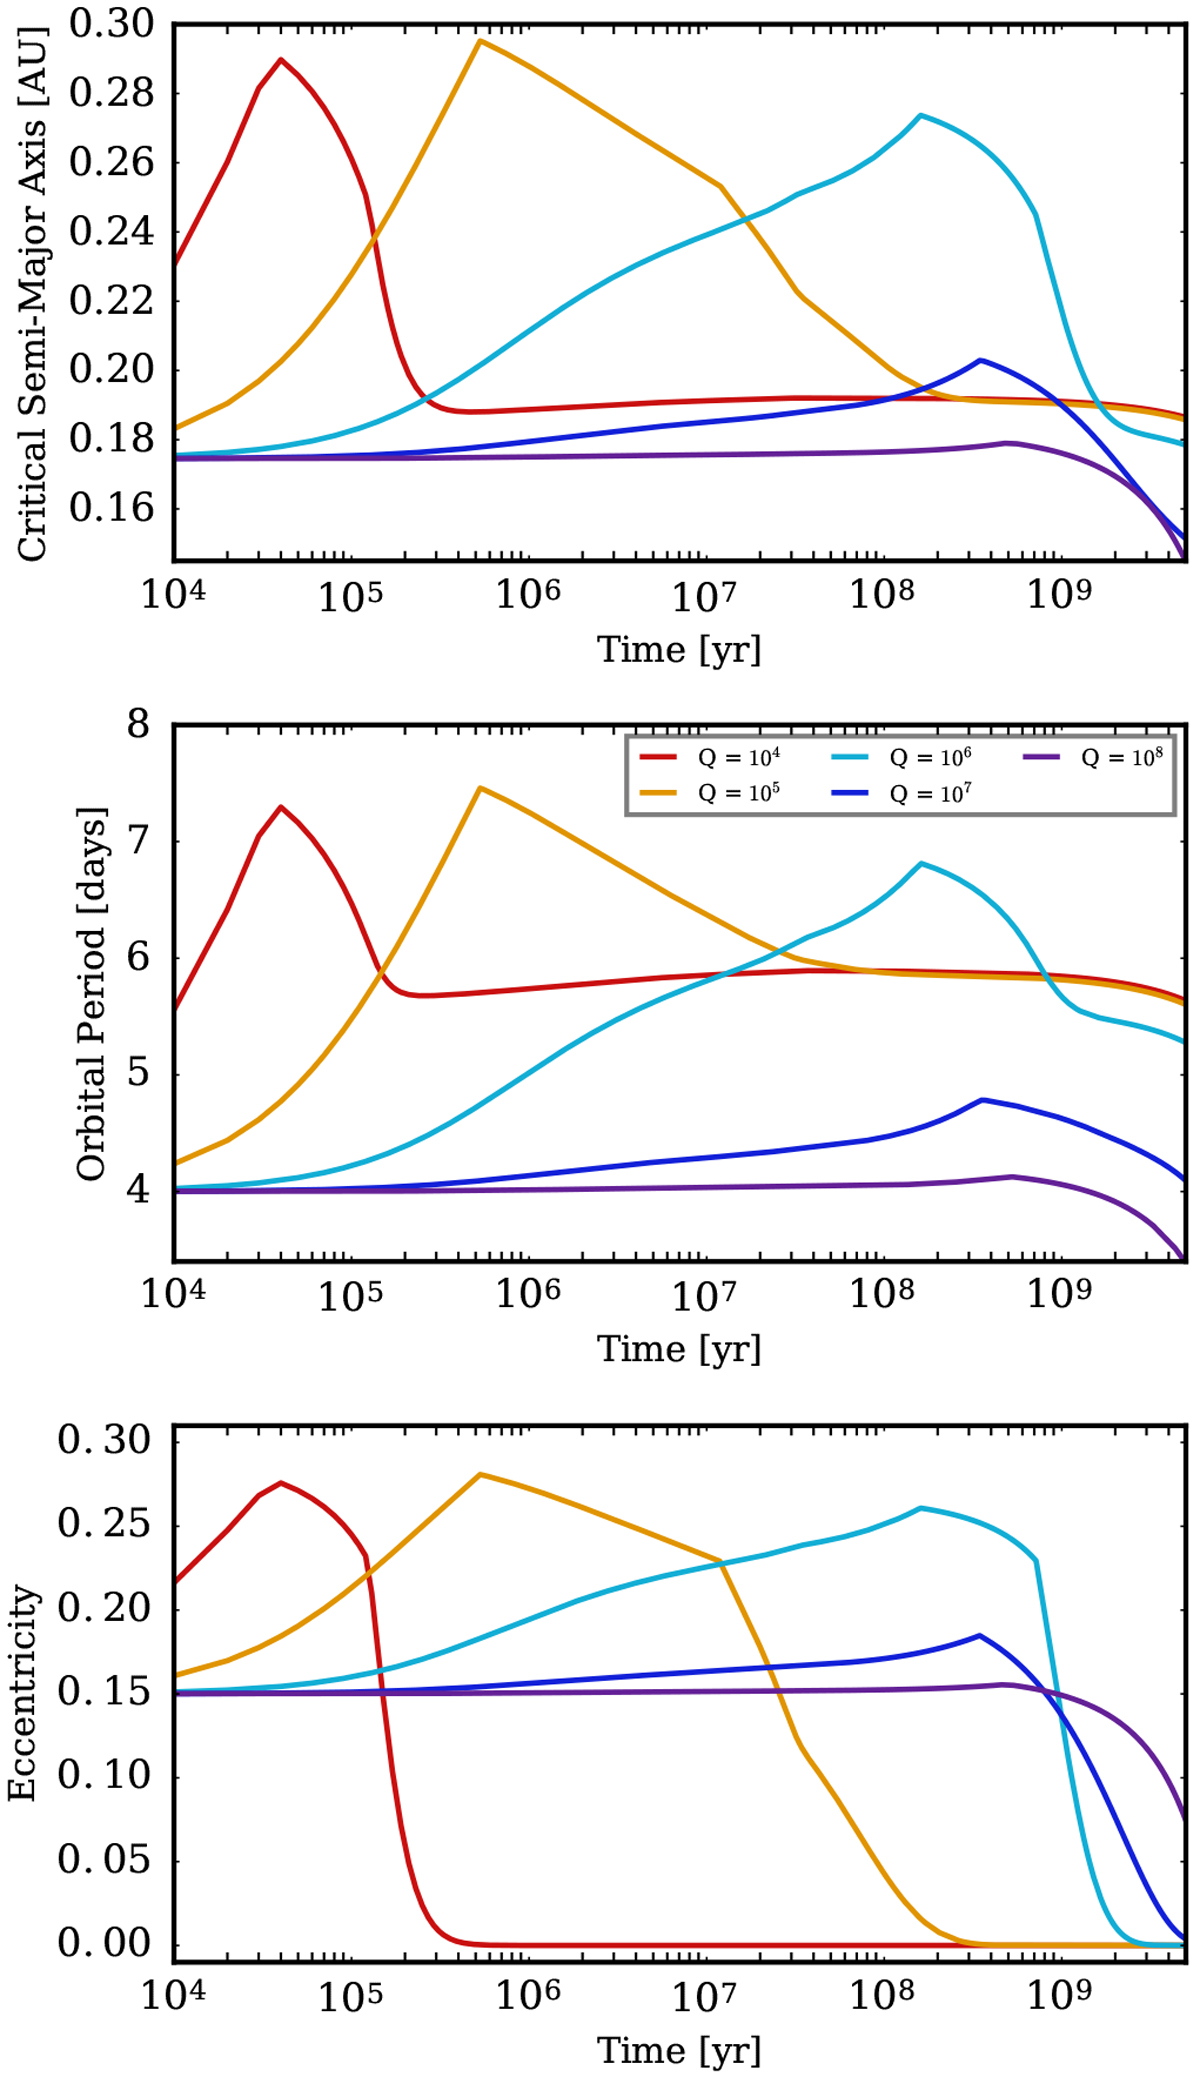
Dynamic evolution of the star system from Fleming et al. (2018), influenced by different initial Q factors usingthe CPL model. Redder curves represent low initial Q values, whilebluer curves represent higher Q values. We used the CPL model along with dynamic radius of gyration. Top: binaries’ dynamic stability limit time evolutions, acrit. Middle: orbital period of the secondary star. Bottom: eccentricity of secondary star. The approximate runtime was 15 min. github.com: cbp_dynamic_stability/Qfactors/
Current usage metrics show cumulative count of Article Views (full-text article views including HTML views, PDF and ePub downloads, according to the available data) and Abstracts Views on Vision4Press platform.
Data correspond to usage on the plateform after 2015. The current usage metrics is available 48-96 hours after online publication and is updated daily on week days.
Initial download of the metrics may take a while.