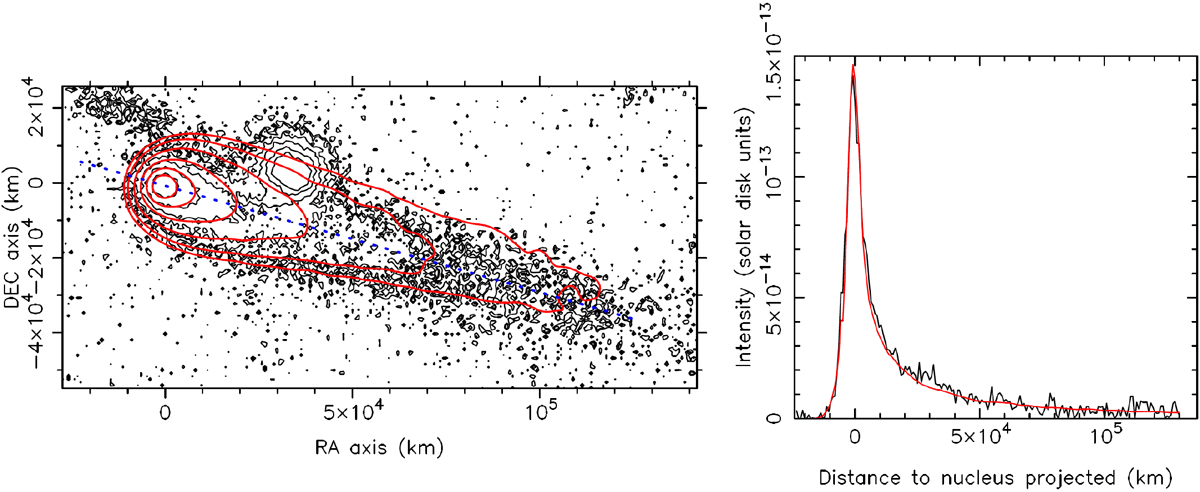
Fig. 5

Fitting of the dust model with the observations. Left panel: comparison of the observed (black contours) and modeled (red contours) tail brightness isophotes. The innermost contour corresponds to 8 × 10⁻¹⁴ solar disk units, and the brightness decreases in factors of two outward. One solar disk intensity unit corresponds to 2.4 × 10⁶ erg s−1 cm−2 sr−1 Å−1. The images are rotated to the conventional orientation (north up, east to the left). The x- and y-axes are labeled in kilometers projected on the sky at the object distance. The blob observed to the right of the comet optocenter is a bright star. Right panel: comparison of observed (black line) and modeled (red line) tail brightness along the direction described by the blue dotted line in the left panel.
Current usage metrics show cumulative count of Article Views (full-text article views including HTML views, PDF and ePub downloads, according to the available data) and Abstracts Views on Vision4Press platform.
Data correspond to usage on the plateform after 2015. The current usage metrics is available 48-96 hours after online publication and is updated daily on week days.
Initial download of the metrics may take a while.


