Fig. 6.
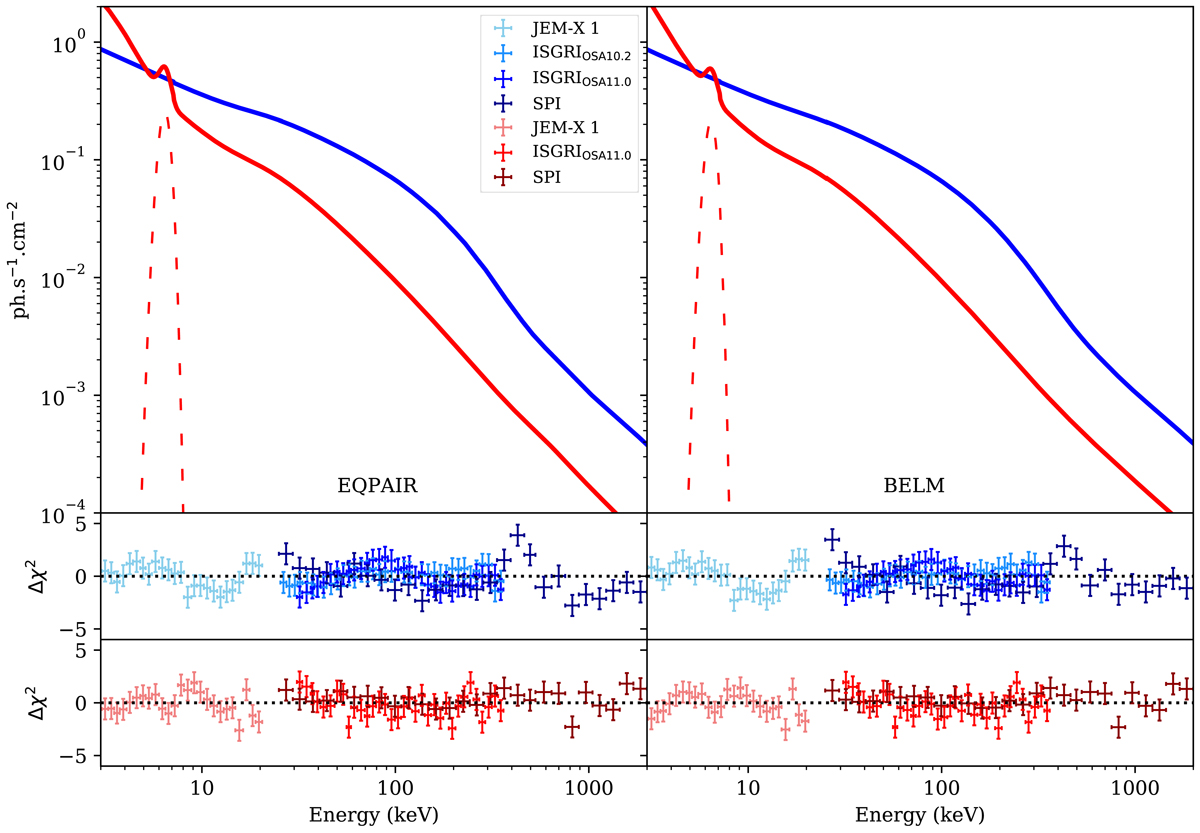
Best models obtained from the fits to spectra for Cyg X-1 with the unmagnetized (left) and magnetized (right) hybrid corona models. Plain lines correspond to the full models whereas the loosely dashed line shows the iron line component. JEM-X, ISGRI, and SPI data are represented in light, intermediate, and darker colors, respectively.
Current usage metrics show cumulative count of Article Views (full-text article views including HTML views, PDF and ePub downloads, according to the available data) and Abstracts Views on Vision4Press platform.
Data correspond to usage on the plateform after 2015. The current usage metrics is available 48-96 hours after online publication and is updated daily on week days.
Initial download of the metrics may take a while.