Fig. 5.
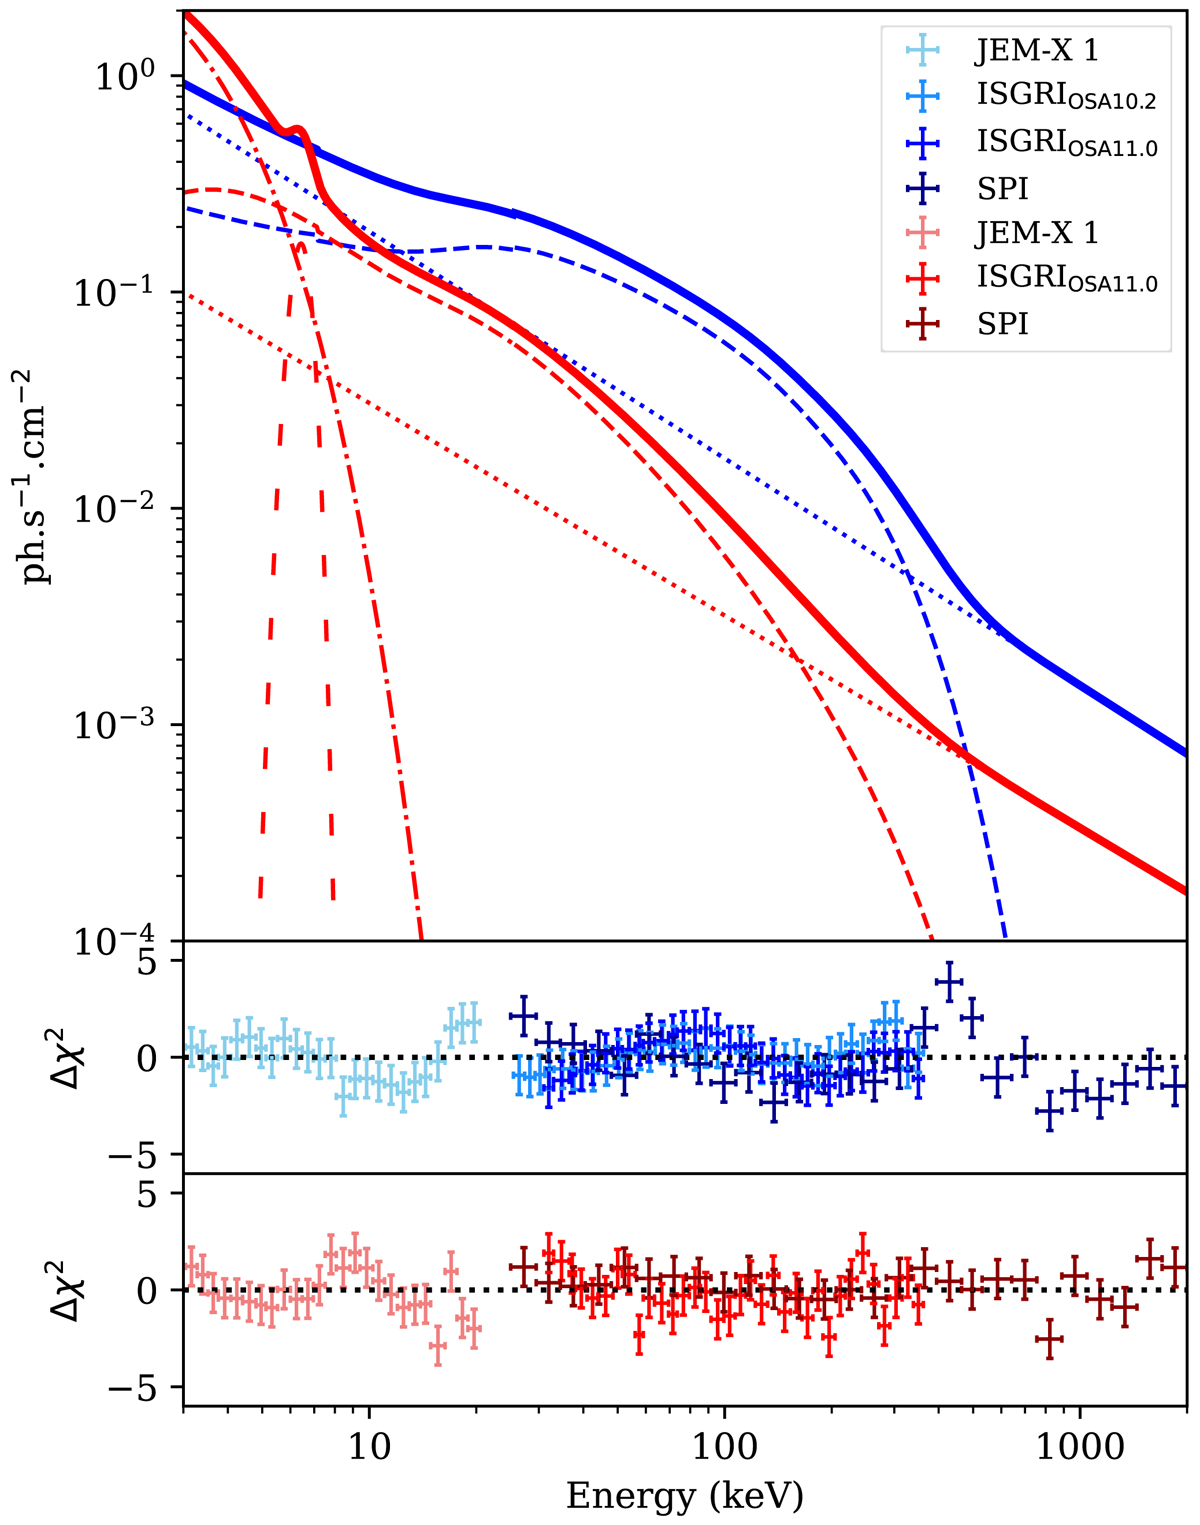
Best-fit models obtained from our phenomenological fitting of the 3–2000 keV LHS (blue) and HSS (red) spectra. JEM-X, ISGRI, and SPI data are represented with light, intermediate, and darker colors respectively. The different model components are shown with different line styles: Comptonized continuum (densely dashed), additional power law (dotted), disk emission (dotted-dashed), and the iron line (loosely dashed). The bottom pan els show the residuals between these models and spectra for the source in both states.
Current usage metrics show cumulative count of Article Views (full-text article views including HTML views, PDF and ePub downloads, according to the available data) and Abstracts Views on Vision4Press platform.
Data correspond to usage on the plateform after 2015. The current usage metrics is available 48-96 hours after online publication and is updated daily on week days.
Initial download of the metrics may take a while.