Fig. 2.
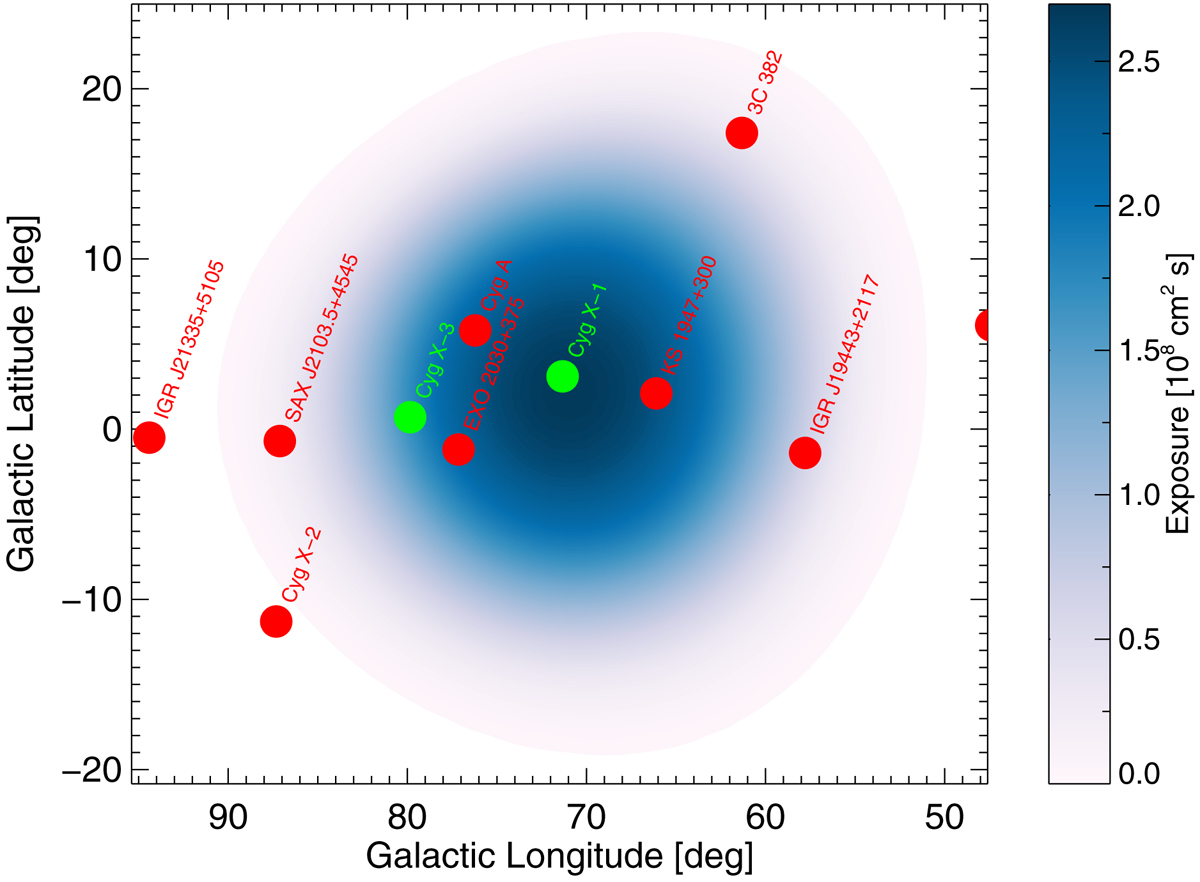
SPI exposure of Cyg X-1 in its soft state in units of 106 cm2 s−1. The fully coded field of view of SPI is 16° ×16°. Green points indicate point sources that have to be taken into account in the SPI data analysis. Red points show other sources listed in the SPI catalog of Bouchet et al. (2011) but only seen below ≲100 keV or at specific flare times.
Current usage metrics show cumulative count of Article Views (full-text article views including HTML views, PDF and ePub downloads, according to the available data) and Abstracts Views on Vision4Press platform.
Data correspond to usage on the plateform after 2015. The current usage metrics is available 48-96 hours after online publication and is updated daily on week days.
Initial download of the metrics may take a while.