Fig. 1.
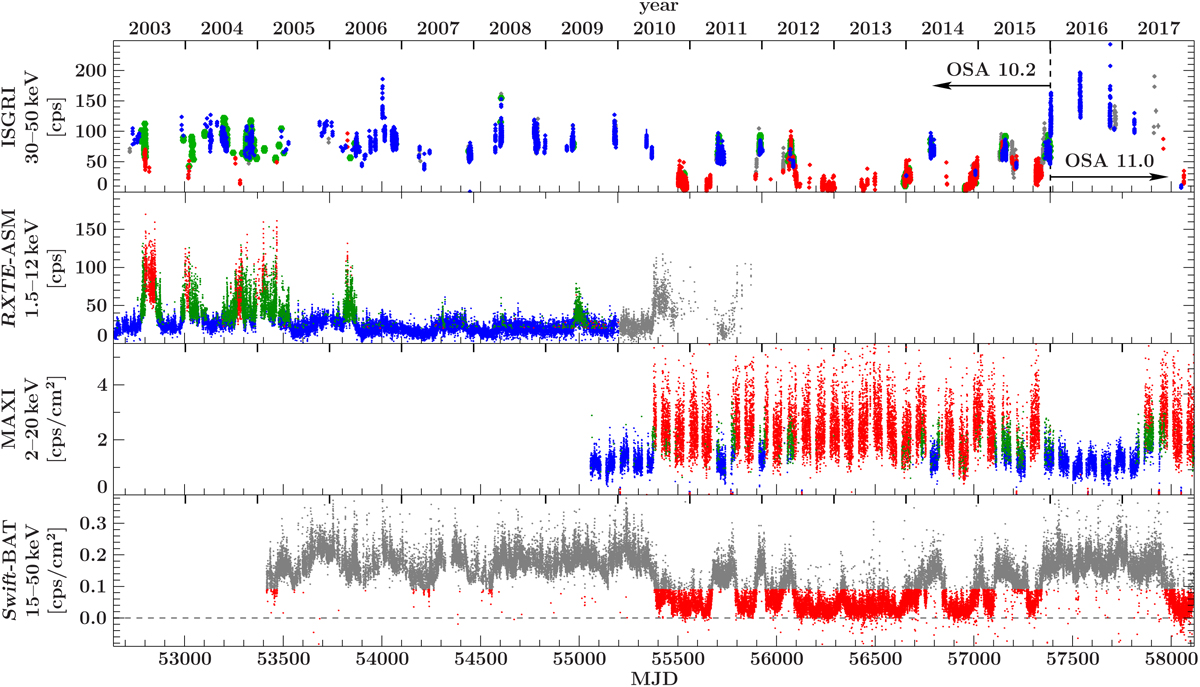
Spectral state evolution of Cyg X-1 between 2003 and 2017 after Grinberg et al. (2013). The HSS is shown in red, the IS in green, and the LHS in blue. Unclassified data are plotted in gray. Upper panel: 30–50 keV INTEGRAL/ISGRI light curve. The vertical dashed line indicates the change of the INTEGRAL data analysis software. Lower three panels: RXTE/ASM, MAXI, and Swift/BAT light curves of Cyg X-1.
Current usage metrics show cumulative count of Article Views (full-text article views including HTML views, PDF and ePub downloads, according to the available data) and Abstracts Views on Vision4Press platform.
Data correspond to usage on the plateform after 2015. The current usage metrics is available 48-96 hours after online publication and is updated daily on week days.
Initial download of the metrics may take a while.