Free Access
Fig. 9.
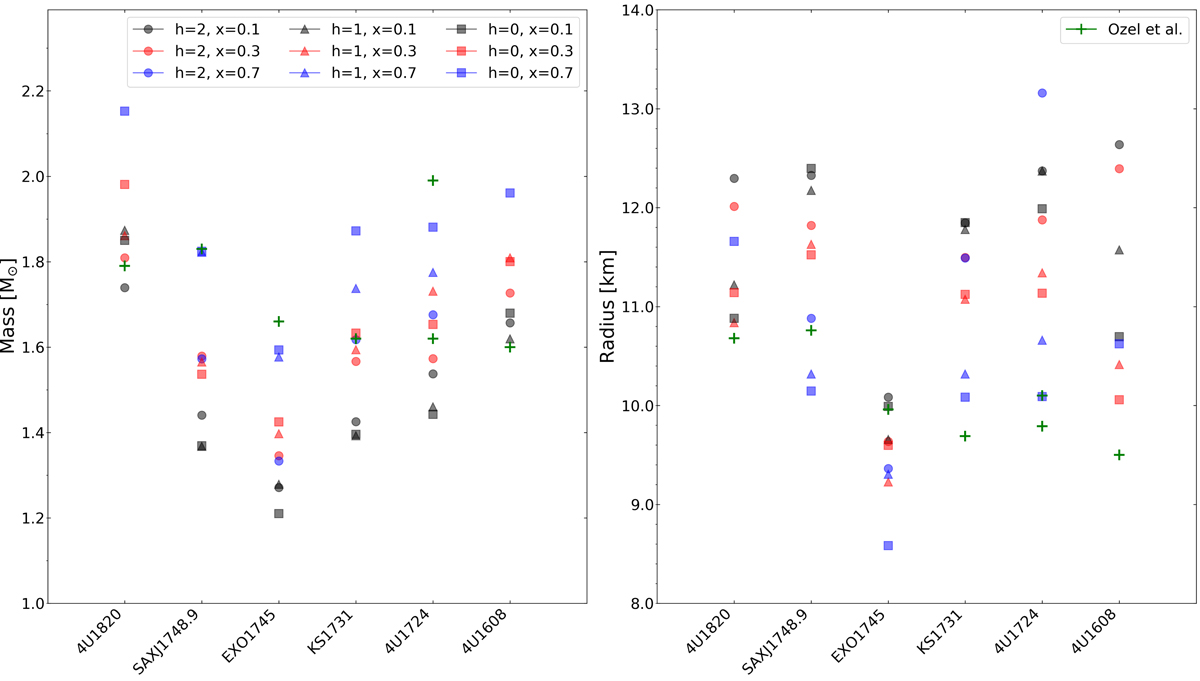
Most probable values of mass (left panel) and radius (right panel) for the six sources that we obtained from our MC sampling for each of the values of X and h. The results from Özel et al. (2016) are also included for comparison. As in Fig. 3, we chose to use a larger distance only for 4U 1820–30.
Current usage metrics show cumulative count of Article Views (full-text article views including HTML views, PDF and ePub downloads, according to the available data) and Abstracts Views on Vision4Press platform.
Data correspond to usage on the plateform after 2015. The current usage metrics is available 48-96 hours after online publication and is updated daily on week days.
Initial download of the metrics may take a while.