Fig. 3.
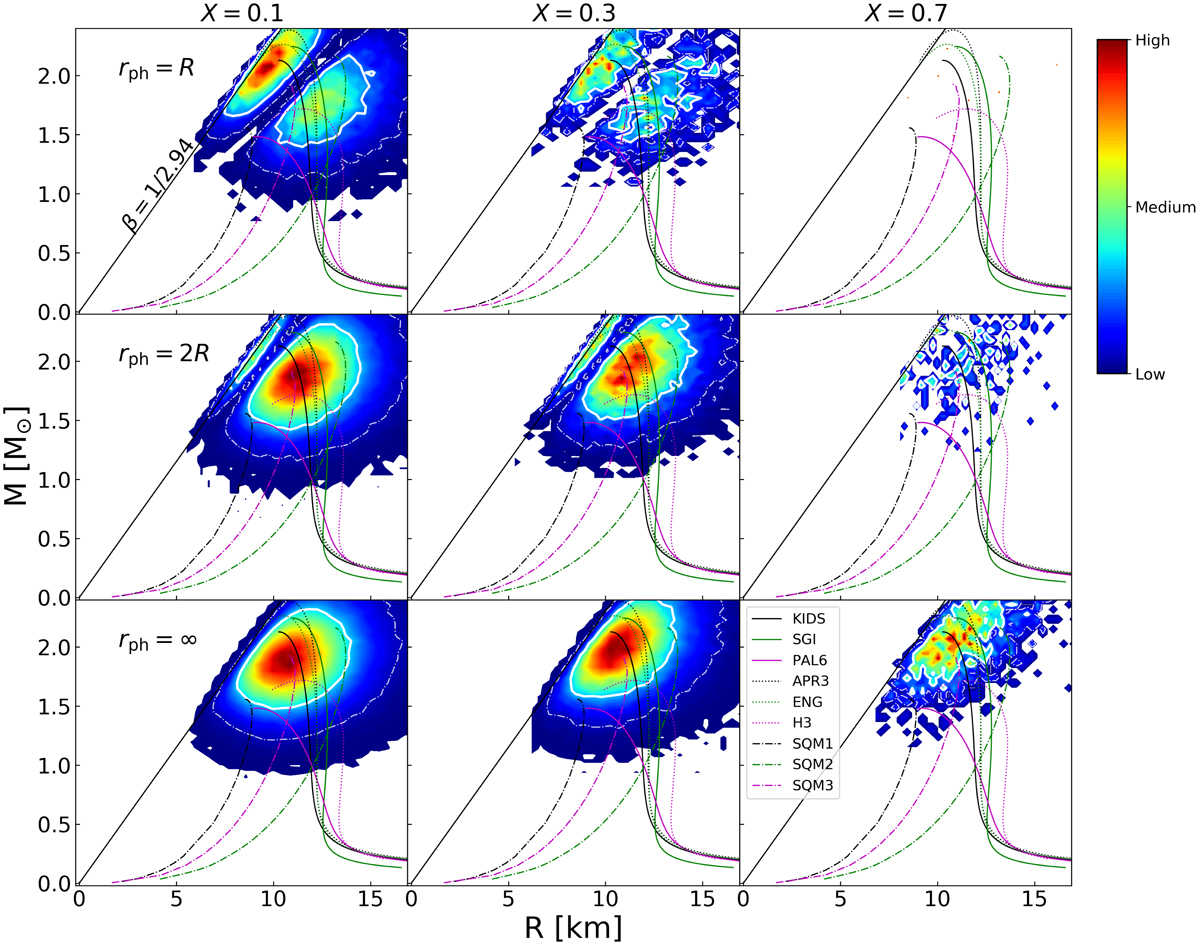
Probability distributions of mass and radius obtained with our MC sampling for 4U 1820–30. Between two distance measurements for this source, we chose to use the larger one, namely, D = 8.4 ± 0.6 kpc, for the result shown here. In all panels, the 68% (solid white lines) and 95% (dot-dashed white lines) confidence contours are drawn. The color bar on the right reflects the relative probabilities the details of which are given in the text. The general relativistic causality limit (βlimit = 1/2.94) is drawn as a black straight line. From top to bottom: h = 2, h = 1 and h = 0, which correspond to rph = R (top), rph = 2R (middle), and rph ≫ R (bottom), respectively. From left to right: X = 0.1 (left), X = 0.3 (middle), and X = 0.7 (right). We note that the relative probabilities Pi of all distributions are normalized by ∫PidRdM = 1. For comparison, we also plot the mass–radius curves predicted from nine equation of state (EoS) models. See the text for the detailed description of these EoS models.
Current usage metrics show cumulative count of Article Views (full-text article views including HTML views, PDF and ePub downloads, according to the available data) and Abstracts Views on Vision4Press platform.
Data correspond to usage on the plateform after 2015. The current usage metrics is available 48-96 hours after online publication and is updated daily on week days.
Initial download of the metrics may take a while.