Fig. 10.
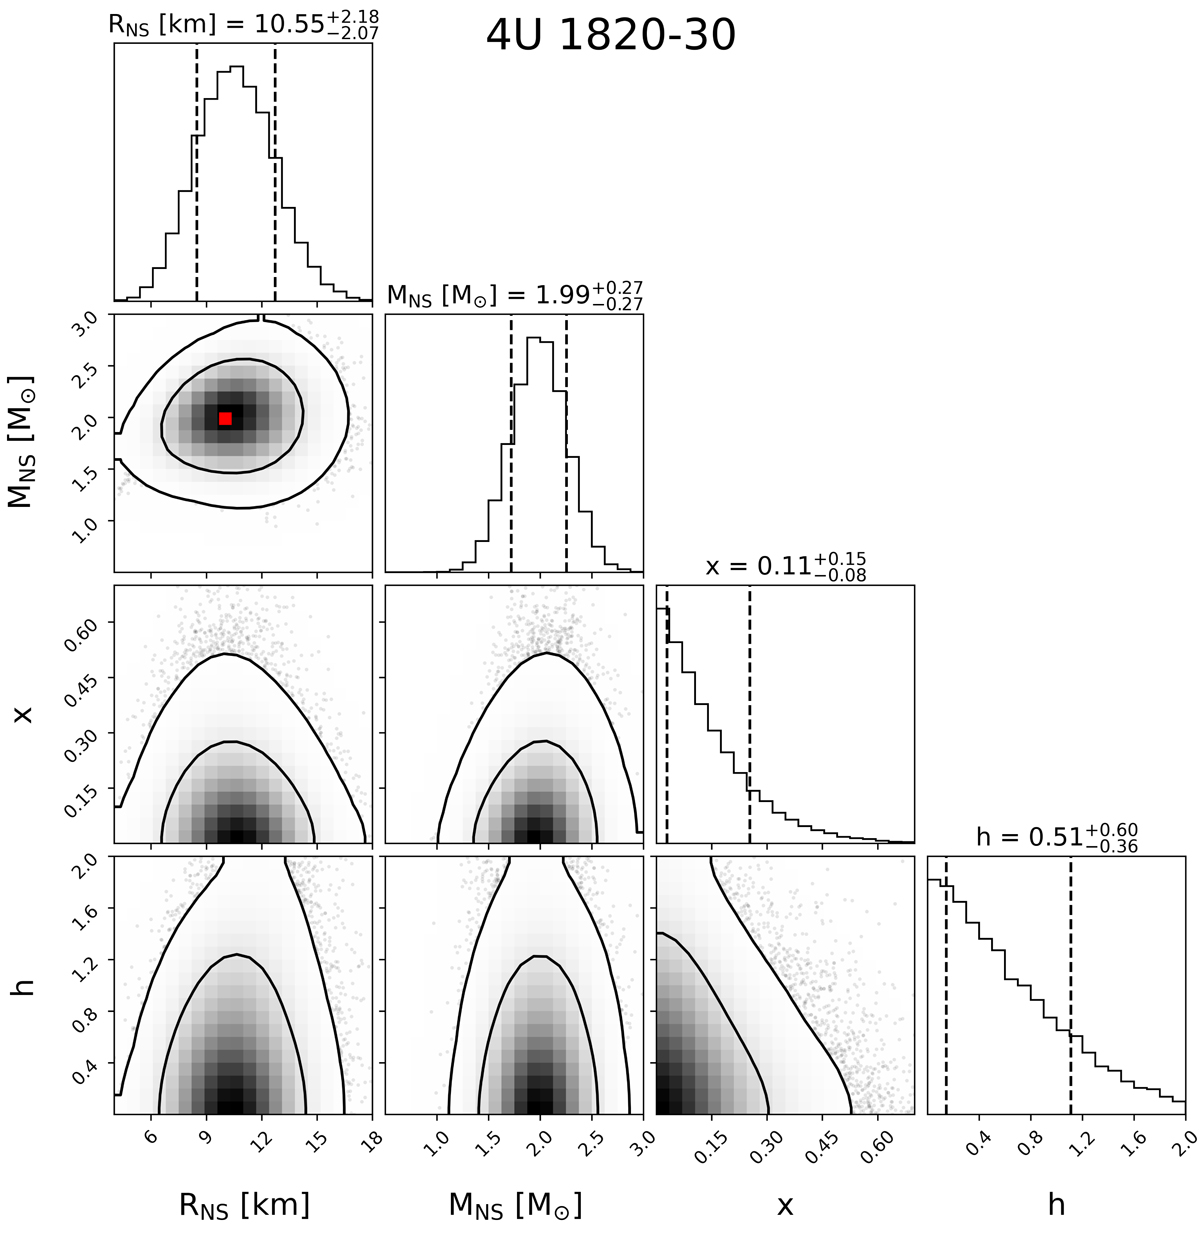
Posterior distributions of neuron star mass (MNS) and radius (RNS), hydrogen mass fraction in the photosphere (X), and h = 2R/rph (which determines the touchdown radius) obtained from our Bayesian analysis for 4U 1820-30. In the panels that present the posterior distributions between two model parameters, the inner and outer solid line correspond to the 68% and 95% confidence contour, respectively. The most probable values of mass and radius are marked with red dots in the distribution plots of mass and radius. In the panels that present the posterior distribution of a single model parameter as a histogram, the region between two vertical dashed lines corresponds to the 68% confidence region. The numbers on top of the histogram panels present the corresponding 68% confidence range around the median value. Since there is no spin measurement available for 4U 1820-30, we use the prior distribution of fNS as a uniform distribution between 250 Hz and 650 Hz, which is the same as in Özel et al. (2016).
Current usage metrics show cumulative count of Article Views (full-text article views including HTML views, PDF and ePub downloads, according to the available data) and Abstracts Views on Vision4Press platform.
Data correspond to usage on the plateform after 2015. The current usage metrics is available 48-96 hours after online publication and is updated daily on week days.
Initial download of the metrics may take a while.