Fig. 1.
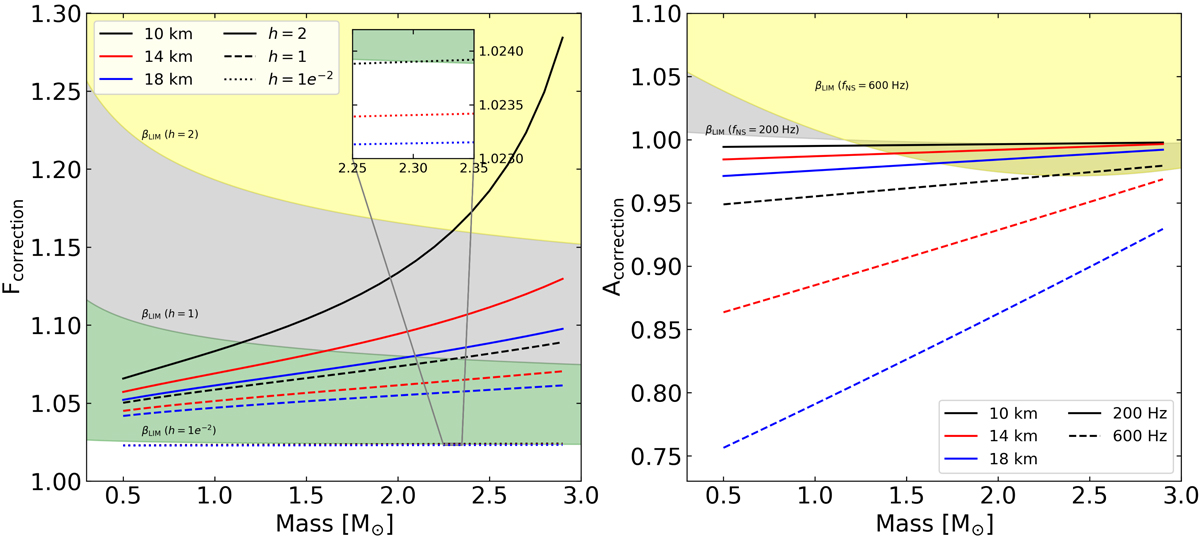
Correction terms, Eqs. (16) and (18), are plotted as a function of mass for a range of radius which is indicated with different colors in both panels. For Fcorr (left panel), plots are drawn with three fixed values of h = 2R/rph. In the case of h = 0.01, all three lines are almost overlapping (see the inset). Acorr is not affected by h but by fNS, for which two values are selected (right panel). In both panels, regions for the causality limit (β = GM/Rc2 < 1/2.94) are indicated with different colors for different values of h and fNS. The regions above the boundaries are not allowed physically.
Current usage metrics show cumulative count of Article Views (full-text article views including HTML views, PDF and ePub downloads, according to the available data) and Abstracts Views on Vision4Press platform.
Data correspond to usage on the plateform after 2015. The current usage metrics is available 48-96 hours after online publication and is updated daily on week days.
Initial download of the metrics may take a while.