Free Access
Fig. 4.
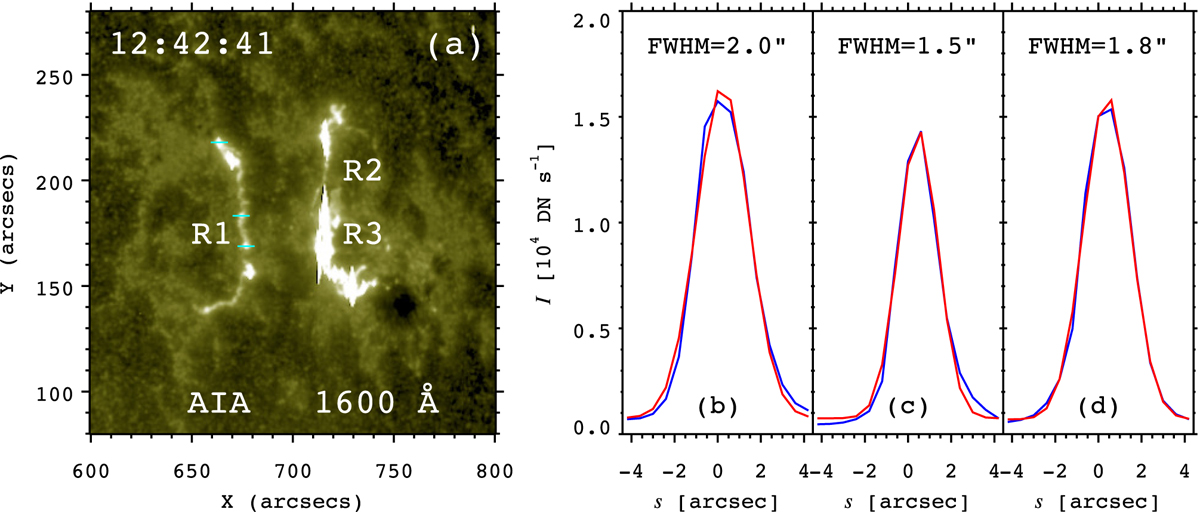
a: AIA 1600 Å image at 12:42:41 UT. R1, R2, and R3 signify the three flare ribbons. Three representative points (green lines) are selected. b–d: intensity distributions across the ribbon (blue lines) and results of Gaussian fitting (red lines). The values of FWHM are labeled.
Current usage metrics show cumulative count of Article Views (full-text article views including HTML views, PDF and ePub downloads, according to the available data) and Abstracts Views on Vision4Press platform.
Data correspond to usage on the plateform after 2015. The current usage metrics is available 48-96 hours after online publication and is updated daily on week days.
Initial download of the metrics may take a while.