Fig. 2.
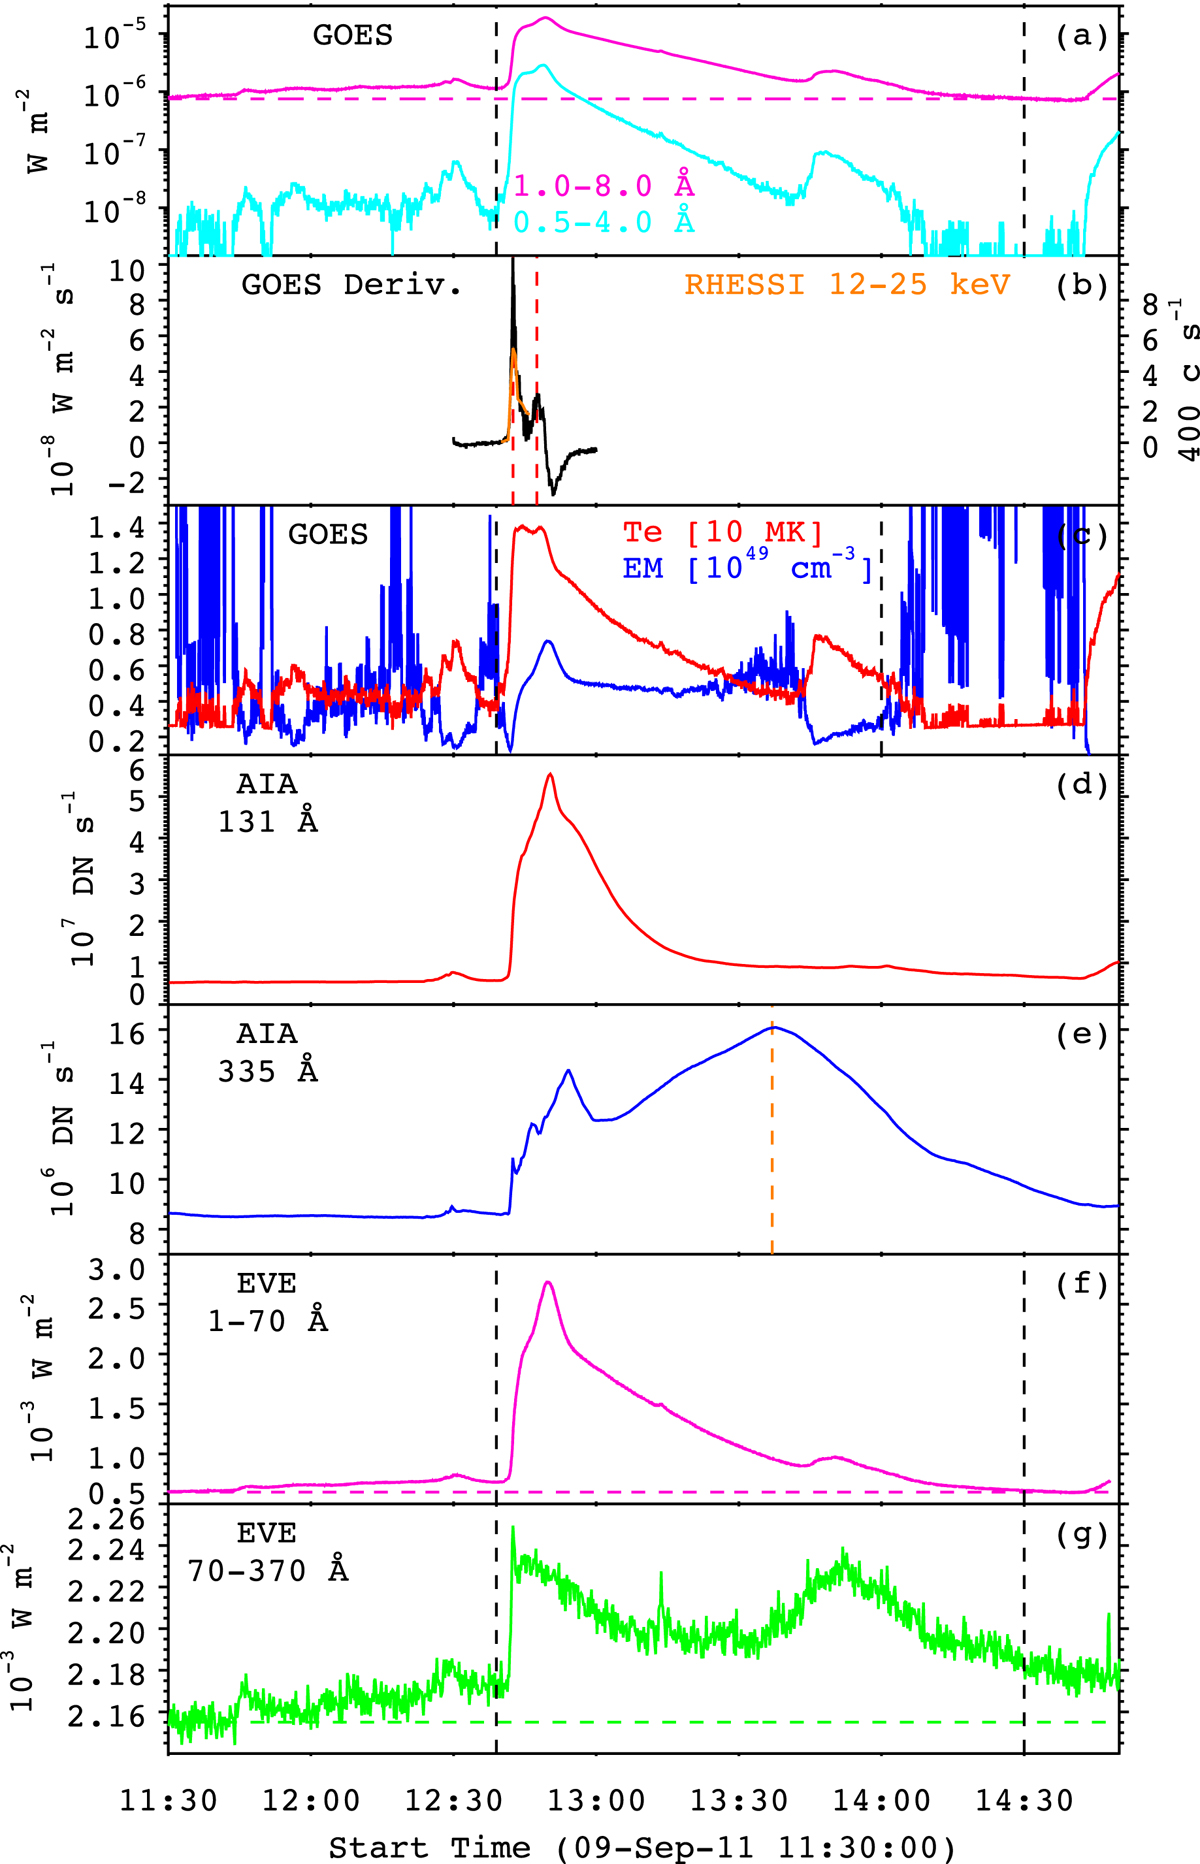
a: SXR light curves of the flare in 0.5−4 Å and 1−8 Å. The magenta dashed line represents the background intensity. b: time derivative of the flux in 1−8 Å (black line) and HXR light curve at 12−25 keV (orange line). The red dashed lines denote the peak times of two-stage energy release. c: time evolution of the flare temperature (Te) and the emission measure (EM) derived from GOES observations. d and e: time evolution of the integral intensity of the flare in 131 Å and 335 Å. The orange dashed line denotes the peak time of EUV late phase. f and g: light curves of the flare in 1−70 and 70−370 Å. The magenta and green dashed lines represent the background intensities, respectively.
Current usage metrics show cumulative count of Article Views (full-text article views including HTML views, PDF and ePub downloads, according to the available data) and Abstracts Views on Vision4Press platform.
Data correspond to usage on the plateform after 2015. The current usage metrics is available 48-96 hours after online publication and is updated daily on week days.
Initial download of the metrics may take a while.