Fig. 1.
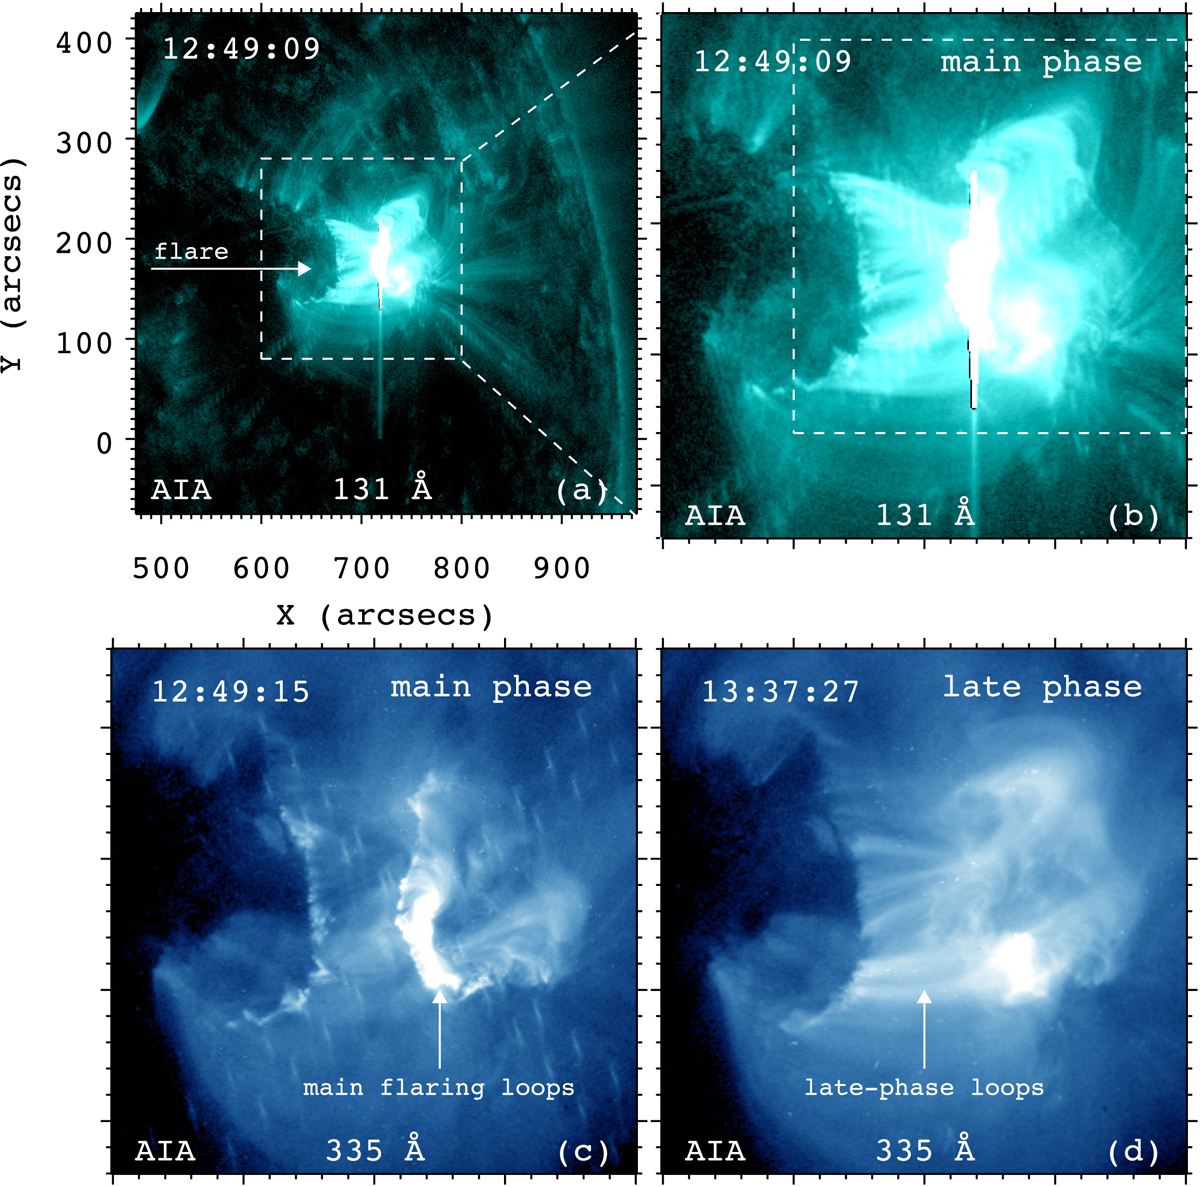
a: AIA 131 Å image at 12:49:09 UT. The white dashed box delineates the flare region. The arrow points to the M1.2 flare. b: closeup of the flare region. c and d: AIA 335 Å images at 12:49:15 UT and 13:37:27 UT. The arrows point to the short main flaring loops and long late-phase loops. The whole evolution of the event observed in 131 Å and 335 Å is shown in a movie (flare.mp4) that is available online.
Current usage metrics show cumulative count of Article Views (full-text article views including HTML views, PDF and ePub downloads, according to the available data) and Abstracts Views on Vision4Press platform.
Data correspond to usage on the plateform after 2015. The current usage metrics is available 48-96 hours after online publication and is updated daily on week days.
Initial download of the metrics may take a while.