Fig. 7.
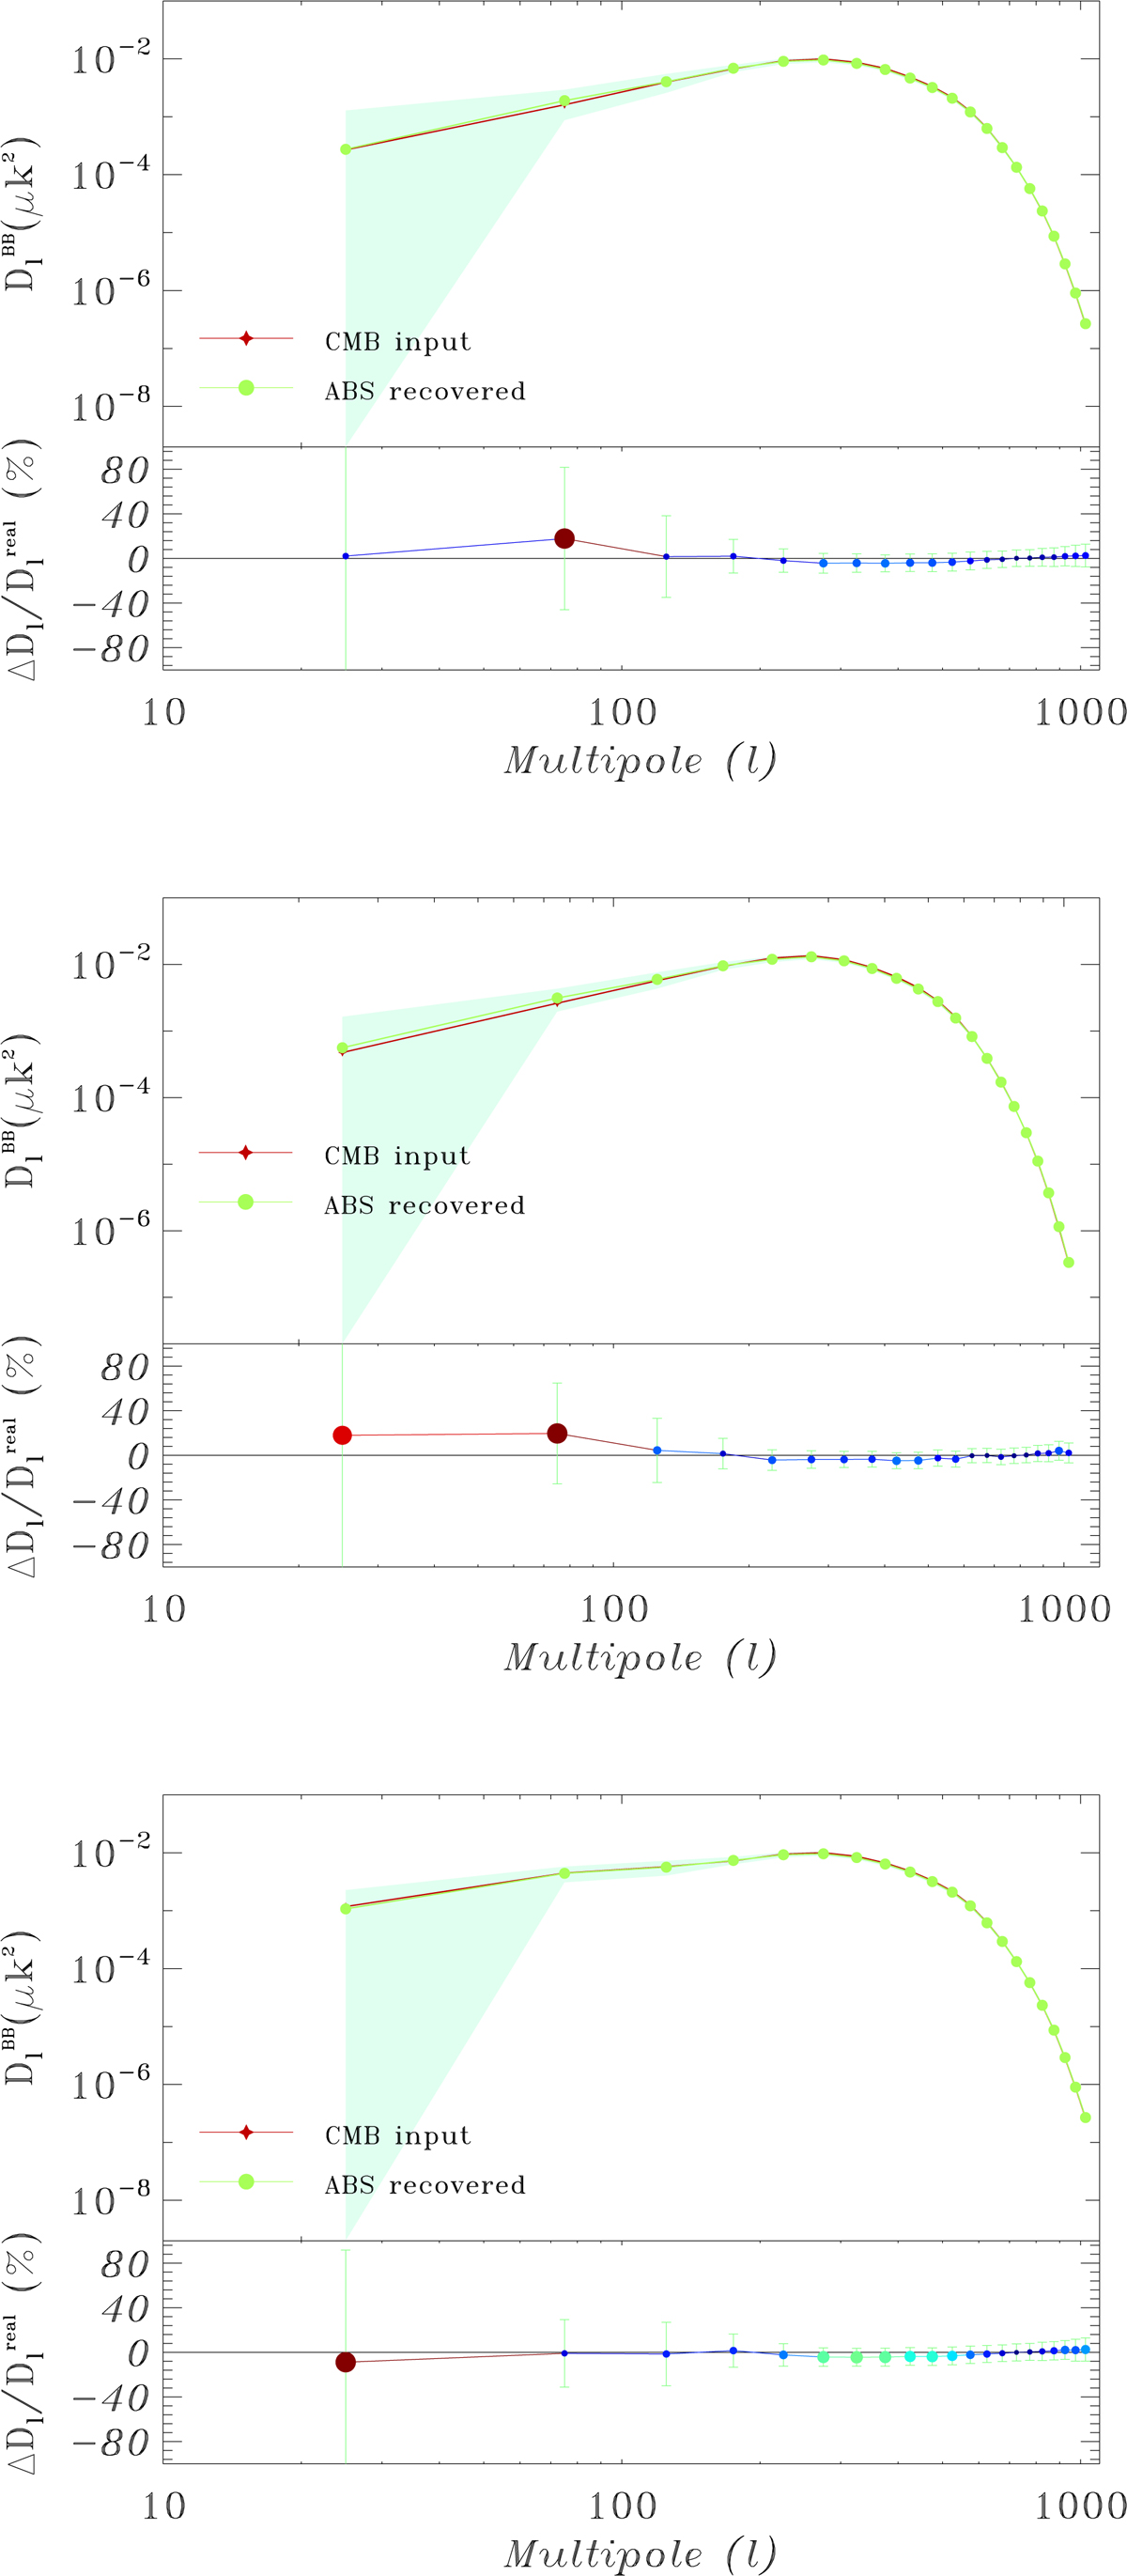
Full-sky B-mode spectrum for r = 0 (top), r = 0.01 (middle), and r = 0.05 (bottom). The red curves correspond to the simulated CMB B-mode spectrum (including lensing B-modes, while the green curves are the ABS estimate. The lower parts of the figures show the relative error in the estimated power spectra. The color and size of the symbols emphasize deviations from 0% error with respect to the input spectrum.
Current usage metrics show cumulative count of Article Views (full-text article views including HTML views, PDF and ePub downloads, according to the available data) and Abstracts Views on Vision4Press platform.
Data correspond to usage on the plateform after 2015. The current usage metrics is available 48-96 hours after online publication and is updated daily on week days.
Initial download of the metrics may take a while.