Fig. 6.
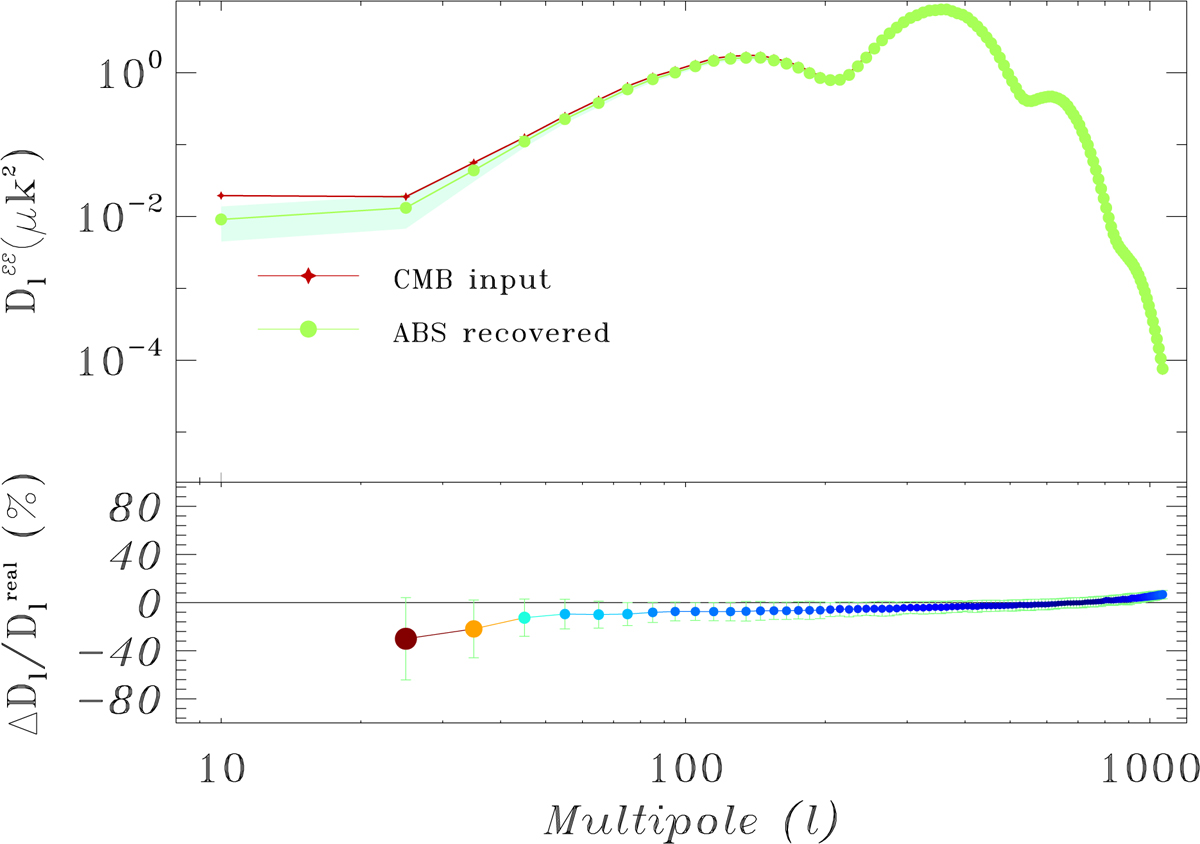
Full-sky binned CMB E-mode power spectrum estimated with ABS, for r = 0, and a Gaussian beam of FWHM = 28.3′. The red curve corresponds to the simulated CMB E-mode spectrum, while the green curve is the ABS estimate. The associated 1-σ statistical errors are also shown as a light green shadow region, computed from 50 simulations with independent realizations of the instrumental noise. The lower part of the figure shows the relative error in the estimated power spectrum, ![]() , as a percentage. The color and size of the symbols emphasize deviations from 0% error with respect to the input spectrum.
, as a percentage. The color and size of the symbols emphasize deviations from 0% error with respect to the input spectrum.
Current usage metrics show cumulative count of Article Views (full-text article views including HTML views, PDF and ePub downloads, according to the available data) and Abstracts Views on Vision4Press platform.
Data correspond to usage on the plateform after 2015. The current usage metrics is available 48-96 hours after online publication and is updated daily on week days.
Initial download of the metrics may take a while.