Fig. 5.
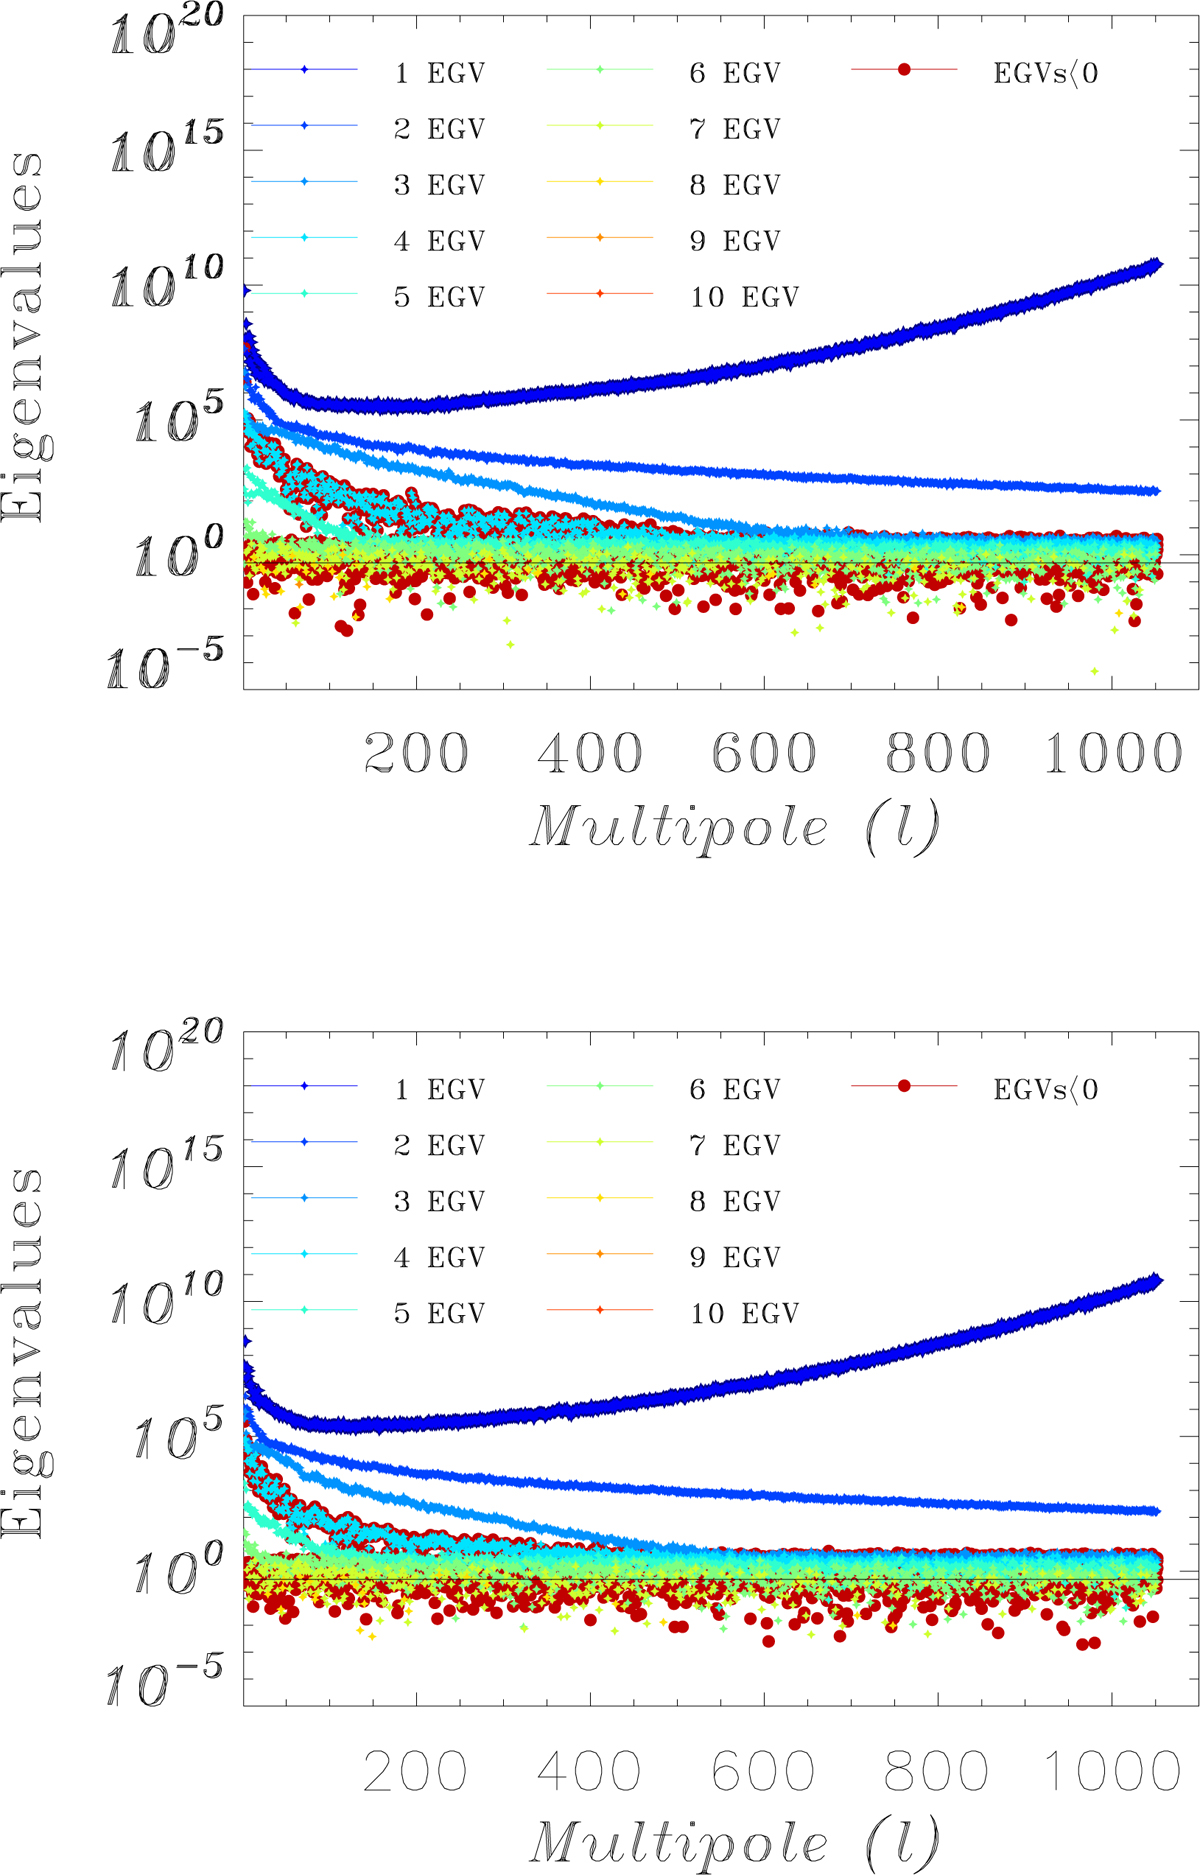
Eigenvalues (labeled as EGV above) of ![]() for each of the ten frequency bands (represented by different symbol colors), considering CMB, foregrounds (synchrotron and thermal dust) and one noise realization. Eigenvalues from the E-mode (upper panel) and B-mode (lower panel) are shown. The threshold
for each of the ten frequency bands (represented by different symbol colors), considering CMB, foregrounds (synchrotron and thermal dust) and one noise realization. Eigenvalues from the E-mode (upper panel) and B-mode (lower panel) are shown. The threshold ![]() is displayed as a solid black horizontal line. We note that
is displayed as a solid black horizontal line. We note that ![]() is not strictly positive: the subspace associated to the lowest eigenvalues is dominated by noise, and hence corresponding eigenvalues are centered around zero after the subtraction of the noise covariance from
is not strictly positive: the subspace associated to the lowest eigenvalues is dominated by noise, and hence corresponding eigenvalues are centered around zero after the subtraction of the noise covariance from ![]() . The eigenvalues,
. The eigenvalues, ![]() , are shown in absolute value, negative eigenvalues being displayed as red dots.
, are shown in absolute value, negative eigenvalues being displayed as red dots.
Current usage metrics show cumulative count of Article Views (full-text article views including HTML views, PDF and ePub downloads, according to the available data) and Abstracts Views on Vision4Press platform.
Data correspond to usage on the plateform after 2015. The current usage metrics is available 48-96 hours after online publication and is updated daily on week days.
Initial download of the metrics may take a while.