Fig. B.1.
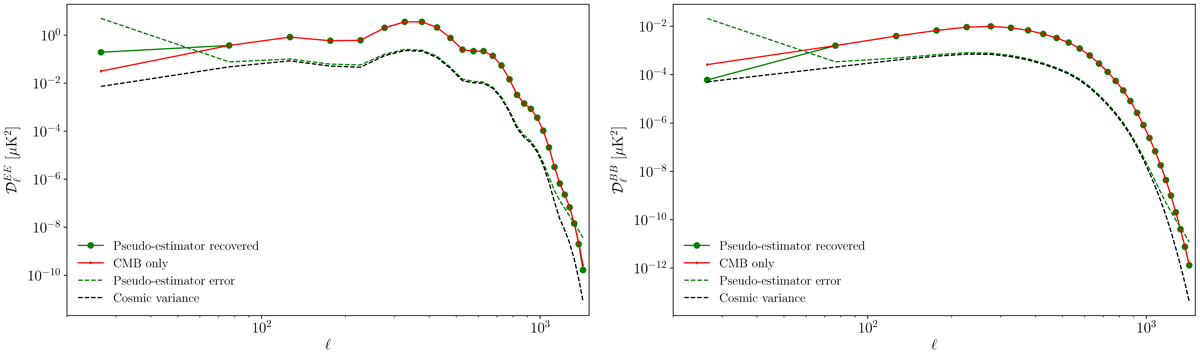
Result for the recovered E-mode (left panel) and B-mode (right panel) spectra for 300 pure CMB realization simulations and r = 0. The red lines show the input CMB power spectra, the solid green lines the mean of the reconstructed power spectra. The green dashed lines represent the standard deviation of the reconstructed power spectra. The black dashed lines are displaying the cosmic variance
Current usage metrics show cumulative count of Article Views (full-text article views including HTML views, PDF and ePub downloads, according to the available data) and Abstracts Views on Vision4Press platform.
Data correspond to usage on the plateform after 2015. The current usage metrics is available 48-96 hours after online publication and is updated daily on week days.
Initial download of the metrics may take a while.