Fig. 10.
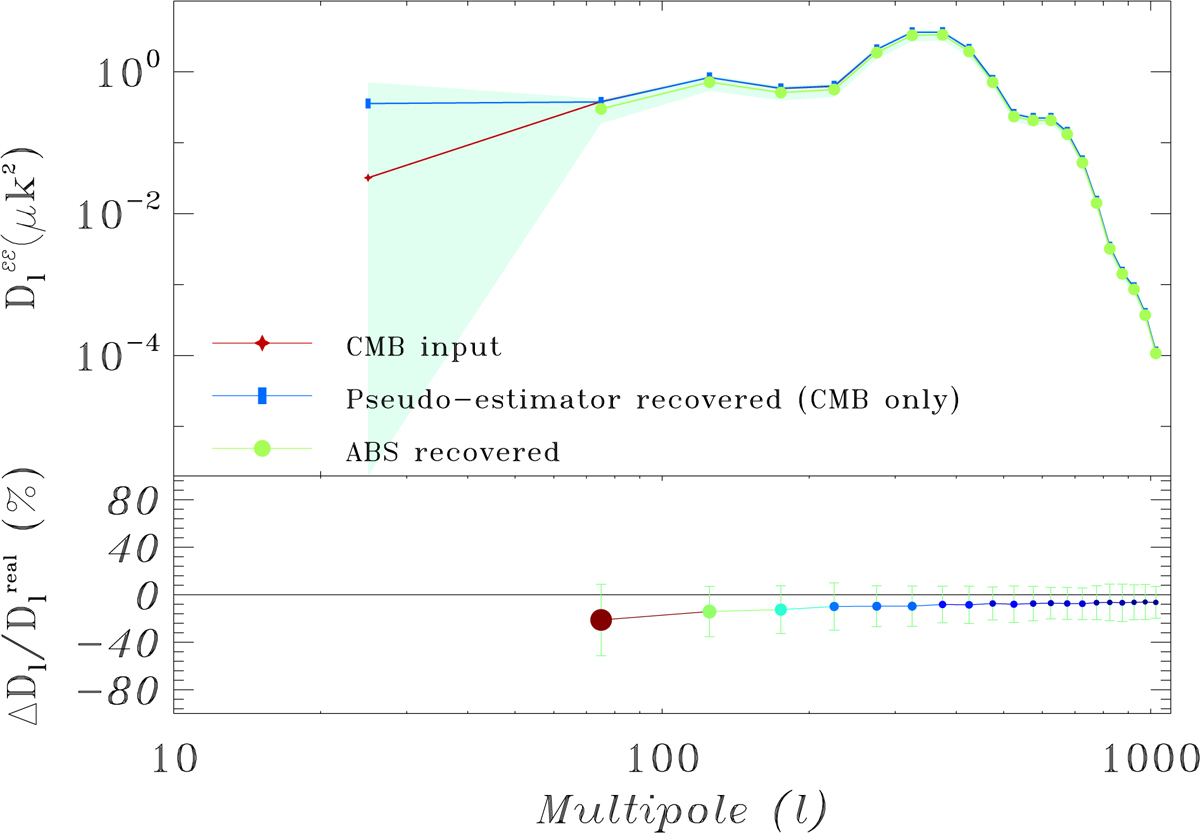
Part-sky CMB E-mode power spectrum (binned with Δl = 50 bands) estimated with ABS (green curve). The red curve is the CMB E-mode input power spectrum. The blue curve, which shows the pseudo-power spectrum computed directly from the CMB sky realization without noise/foregrounds, using the Smith and Zaldarriaga E/B separation method, illustrates the uncertainties inherent to the correction of the E–B mixing. The 1-σ statistical errors computed from 50 simulations with independent realizations of the instrumental noise are shown as the light green shadow region. The relative error, ![]() , is shown in percentage level (the error in the first bin, which is much larger than the y-axis scale, is not displayed). The symbol colors and sizes illustrate deviations from 0% in respect to the “true” spectrum.
, is shown in percentage level (the error in the first bin, which is much larger than the y-axis scale, is not displayed). The symbol colors and sizes illustrate deviations from 0% in respect to the “true” spectrum.
Current usage metrics show cumulative count of Article Views (full-text article views including HTML views, PDF and ePub downloads, according to the available data) and Abstracts Views on Vision4Press platform.
Data correspond to usage on the plateform after 2015. The current usage metrics is available 48-96 hours after online publication and is updated daily on week days.
Initial download of the metrics may take a while.