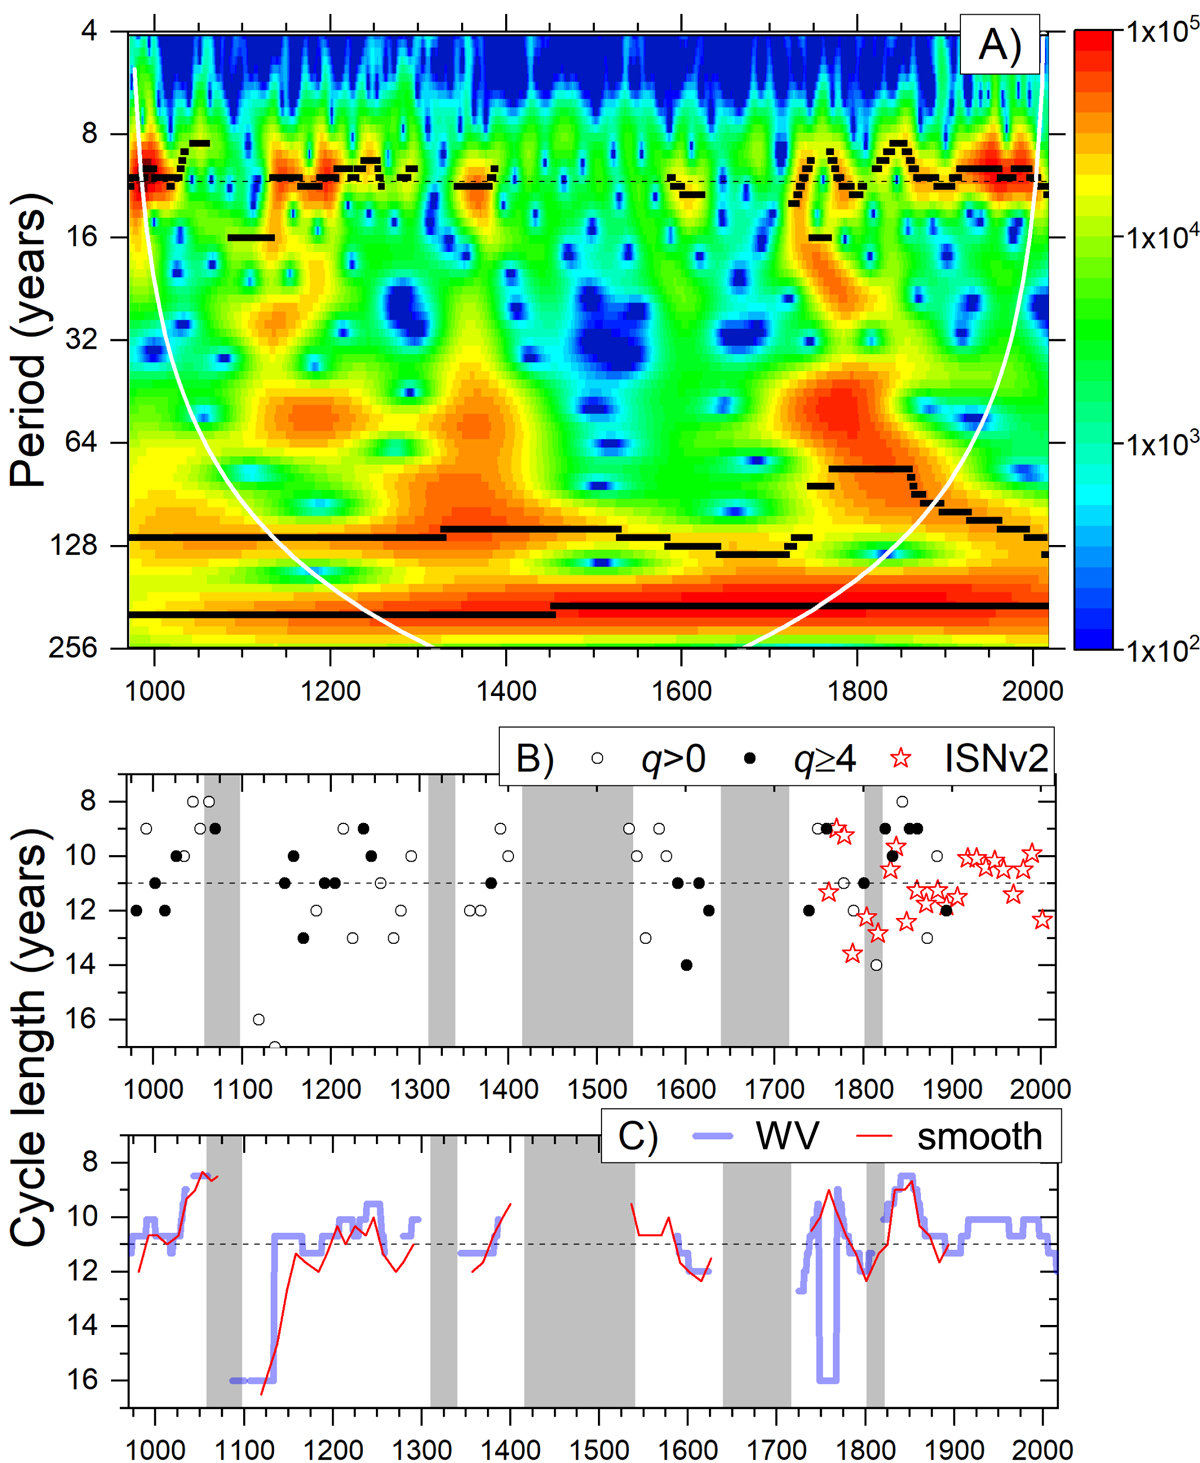
Fig. 16.

Panel A: wavelet power spectrum (Morlet basis, k = 6) of the reconstructed SN series, extended by ISN (v.2) after 1900. The white curve bounds the cone of influence (COI) where the spectrum is unreliable because of the proximity to the edges of the series. Black dots denote local maxima of the power (> 104) in the period bands 7–16, 75–140, and 180–250 years. The horizontal dashed line marks the location of the 11-year period. Panel B: cycle length (minimum-to-minimum) as a function of time (assigned to the cycle maximum year) for resolvable (q > 0, 56 cycles) reconstructed cycles (open dots) and for well-defined cycles (q ≥ 4, 25 cycles, filled circles). Red stars are the cycle lengths, rounded to the nearest integer (to be reduced to the annual resolution), in the ISN (v.2) series (http://www.sidc.be/silso/cyclesminmax) for 1750–2019. The dashed line represents the mean cycle length of 11 years over the ISN series. The grey shading denotes grand minima of solar activity. Panel C: comparison between the smoothed cycle-length evolution. The smooth red curve is the three-point running mean of the individual cycle lengths (q > 0). The light blue WV curve is the wavelet-defined period (identical to the upper black curve in panel A).
Current usage metrics show cumulative count of Article Views (full-text article views including HTML views, PDF and ePub downloads, according to the available data) and Abstracts Views on Vision4Press platform.
Data correspond to usage on the plateform after 2015. The current usage metrics is available 48-96 hours after online publication and is updated daily on week days.
Initial download of the metrics may take a while.


