Fig. 14.
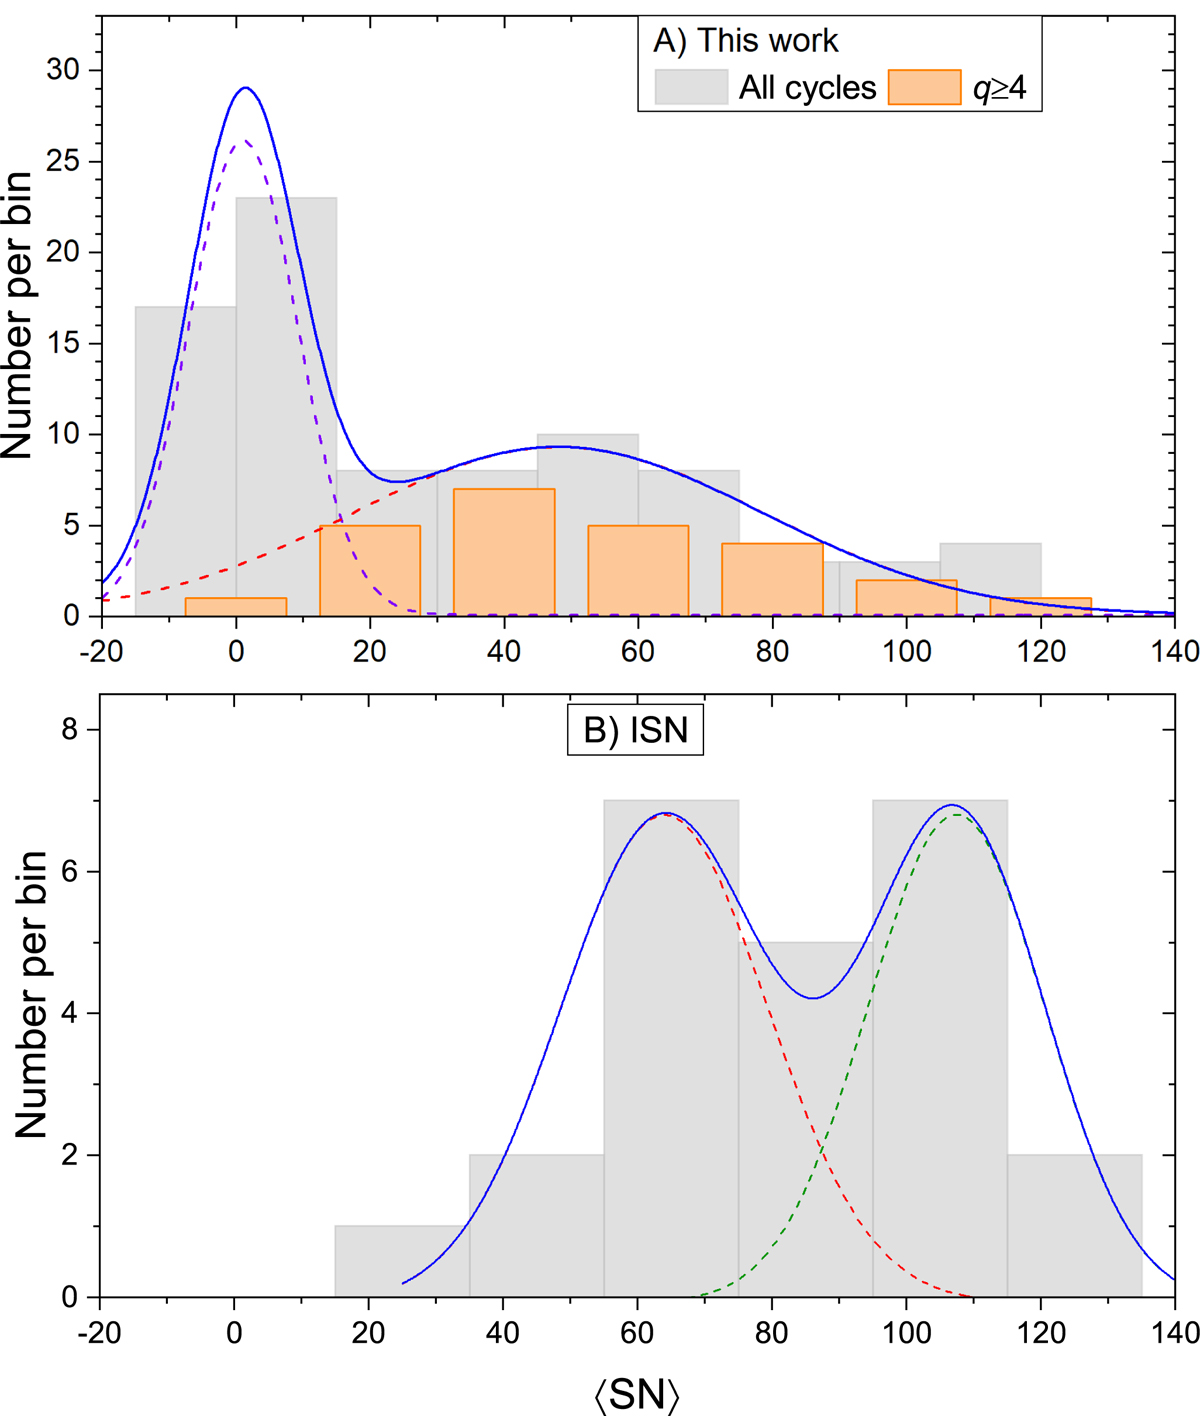
Distribution of cycle-averaged ⟨SN⟩ SNs along with fitted bimodal Gaussians. Panel A: SNs reconstructed here for 971–1900 (85 full cycles). The two curves are as follows: grand-minimum mode (magenta dashed line, mean m = 1, σ = 8) and normal mode (red dashed line m = 48, σ = 31). Orange bars correspond to the well-defined cycle q ≥ 4 (m = 49, σ = 36, 25 cycles). Panel B: ISN (v.2) SNs for 1750–2019 (24 full cycles), including two modes: a normal one (m = 64, σ = 16) and a grand-maximum one (m = 107, σ = 13).
Current usage metrics show cumulative count of Article Views (full-text article views including HTML views, PDF and ePub downloads, according to the available data) and Abstracts Views on Vision4Press platform.
Data correspond to usage on the plateform after 2015. The current usage metrics is available 48-96 hours after online publication and is updated daily on week days.
Initial download of the metrics may take a while.