Fig. 11.
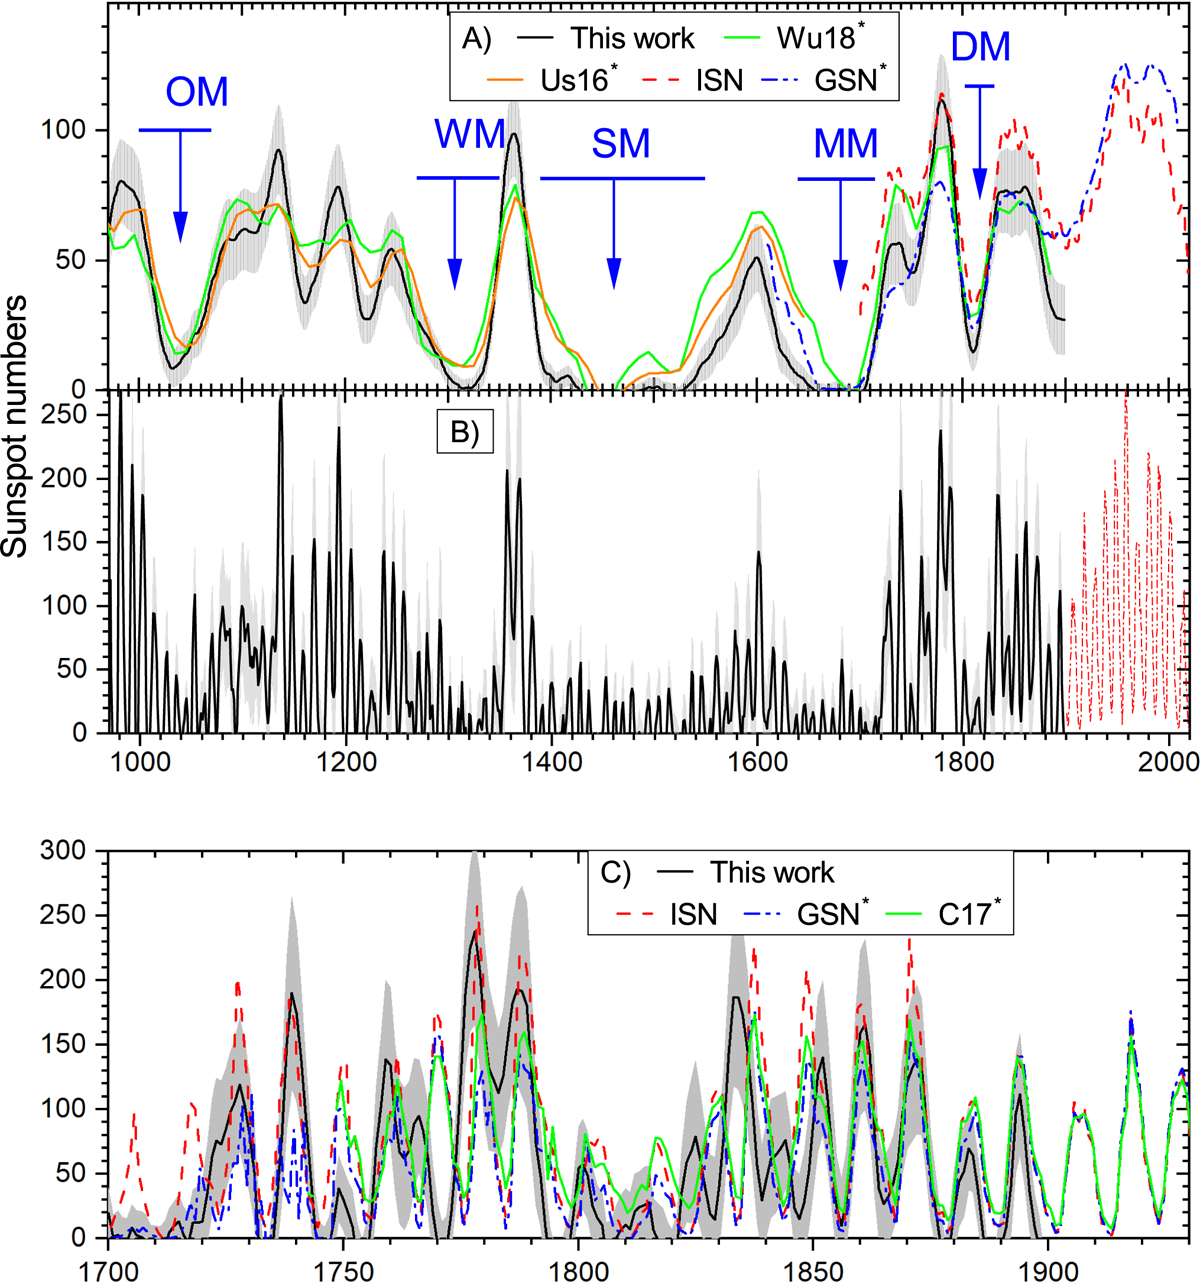
Time evolution of the reconstructed SNs (black curve with ±1σ grey-shaded uncertainties) in comparison with other direct and indirect SN series. Panel B: final annual reconstruction, and Panel C: its zoom for the period after 1700. Panel A: smoothed (15-yr first SSA component) annual series in comparison with other similarly smoothed or decadal series. These series are as follows: ISN (v.2, SILSO), GSN* (Hoyt & Schatten 1998), C17* (Chatzistergos et al. 2017), as well as two recent reconstructions based on 14C – U16* (Usoskin et al. 2016) and W18* (Wu et al. 2018b) (the asterisk indicates that the series is scaled up by a factor of 1.667 to match the ISN v.2 definition). Blue arrows denote grand minima of solar activity: Oort (OM), Wolf (WM), Spörer(SM), Maunder (MM), and Dalton (DM) minima. The data are available at the CDS.
Current usage metrics show cumulative count of Article Views (full-text article views including HTML views, PDF and ePub downloads, according to the available data) and Abstracts Views on Vision4Press platform.
Data correspond to usage on the plateform after 2015. The current usage metrics is available 48-96 hours after online publication and is updated daily on week days.
Initial download of the metrics may take a while.