Fig. 4.
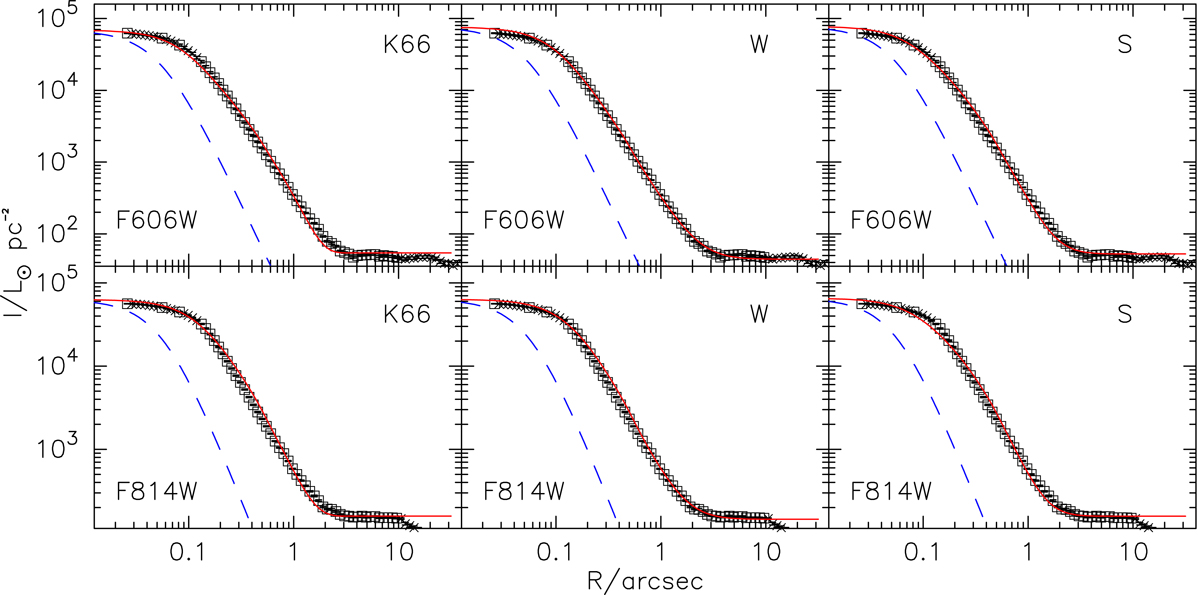
Surface brightness profiles of and model fits to GC1, with the data of the F606W and F814W bands from top to bottom. The three panels in each line from left to right are the fits to the King model (K66), Wilson model (W), and Sérsic model (S). The open squares are the data points included in the model fitting, while the crosses are points flagged as DEP or BAD, which are not used to constrain the fit. The best fitting models are shown with a red solid line. The blue dashed lines represent the shapes of the PSFs for the filters used.
Current usage metrics show cumulative count of Article Views (full-text article views including HTML views, PDF and ePub downloads, according to the available data) and Abstracts Views on Vision4Press platform.
Data correspond to usage on the plateform after 2015. The current usage metrics is available 48-96 hours after online publication and is updated daily on week days.
Initial download of the metrics may take a while.