Fig. 2.
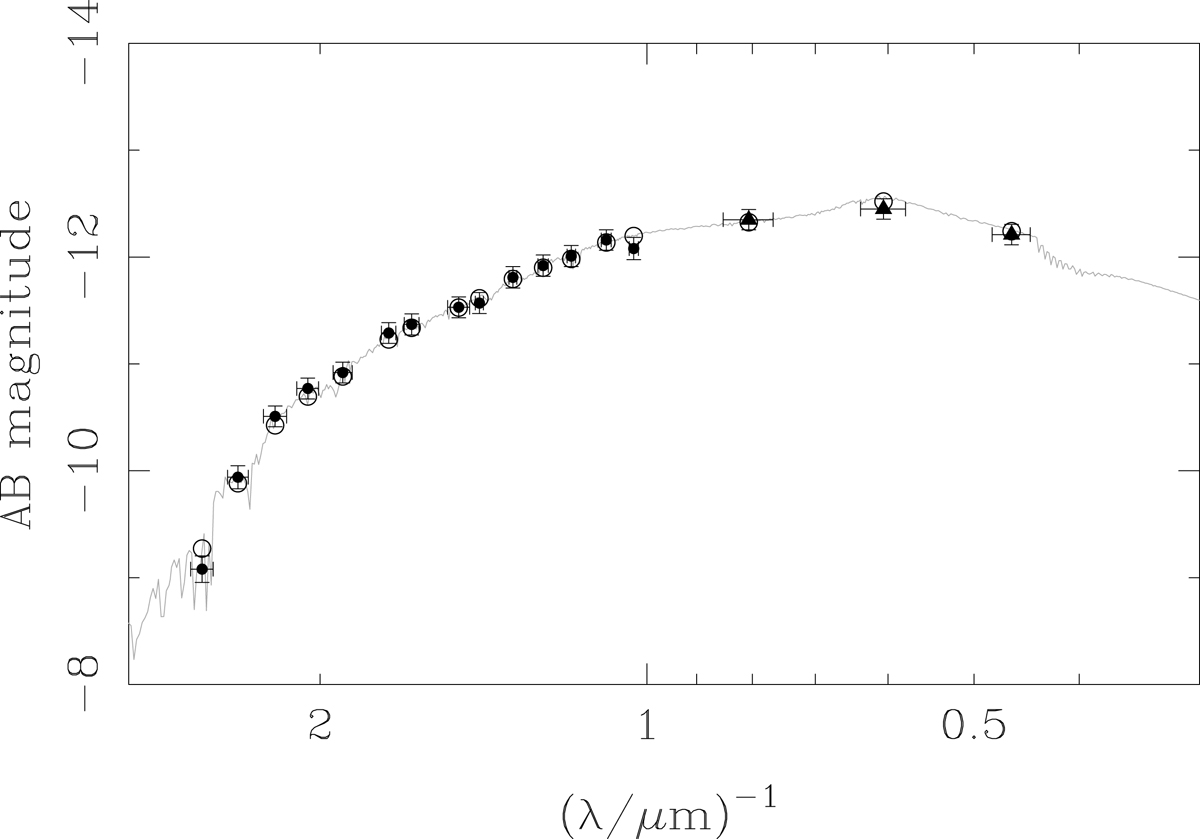
Best-fitting, integrated theoretical GALEV SEDs compared to the intrinsic SEDs of GC1. The photometric measurements are shown as symbols with error bars (vertical error bars for photometric uncertainties and horizontal ones for the approximate wavelength coverage of each filter). The open circles represent the calculated magnitudes of the model SED for each filter.
Current usage metrics show cumulative count of Article Views (full-text article views including HTML views, PDF and ePub downloads, according to the available data) and Abstracts Views on Vision4Press platform.
Data correspond to usage on the plateform after 2015. The current usage metrics is available 48-96 hours after online publication and is updated daily on week days.
Initial download of the metrics may take a while.