Free Access
Fig. 7
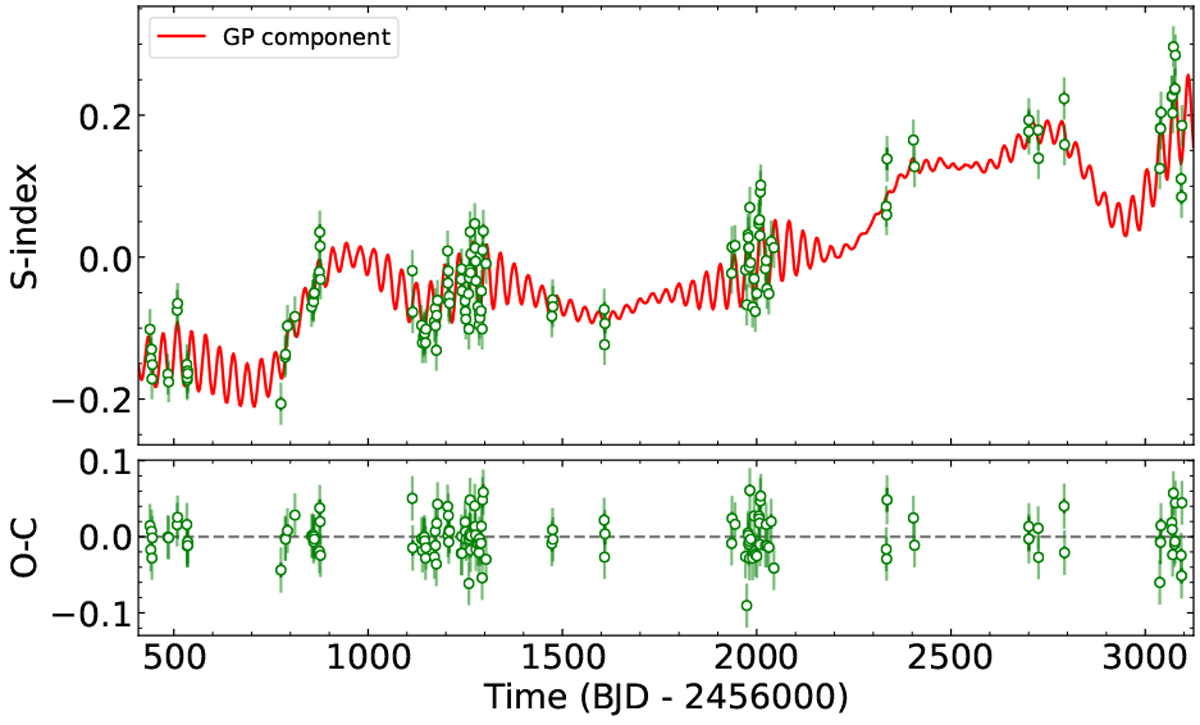
GJ 720 A original S-index data together with the best model and the residuals. The fitted GP model (red line) corresponds to an exp-sin-squared kernel multiplied by a squared-exponential kernel modeling the stellar variability. The error bars (green) take into account the jitter (light green).
Current usage metrics show cumulative count of Article Views (full-text article views including HTML views, PDF and ePub downloads, according to the available data) and Abstracts Views on Vision4Press platform.
Data correspond to usage on the plateform after 2015. The current usage metrics is available 48-96 hours after online publication and is updated daily on week days.
Initial download of the metrics may take a while.