Free Access
Fig. 6
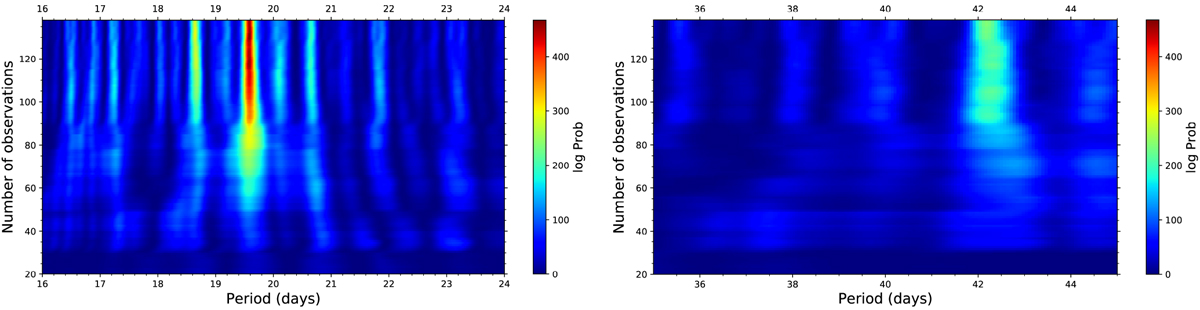
Evolution of the s-BGLS periodogram of the HARPS-N RV data of GJ 720 A. Left panel: the most probable period at 19.5 days (in red) is clearly visible after around Nobs > 80. Right panel:s-BGLS periodogram at around 40 days produced by the stellar variability.
Current usage metrics show cumulative count of Article Views (full-text article views including HTML views, PDF and ePub downloads, according to the available data) and Abstracts Views on Vision4Press platform.
Data correspond to usage on the plateform after 2015. The current usage metrics is available 48-96 hours after online publication and is updated daily on week days.
Initial download of the metrics may take a while.