Fig. 5
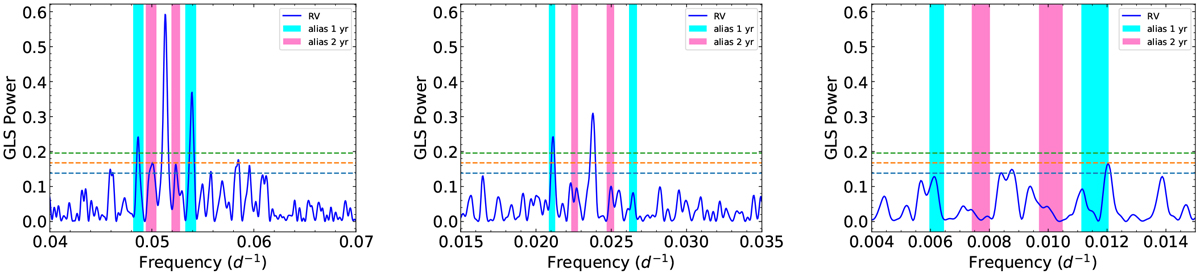
Zoom-in on the GLS periodogram of the HARPS-N RV data of GJ 720 A (blue solid line) around the strongest signals at 19.5 (left panel), 42.1 (center panel), and 112.4 days (right panel). The corresponding values in the frequency domain are 0.05128, 0.02375, and 0.0890 day−1, respectively.The horizontal dashed lines indicate the different FAPs: 0.1% (green), 1% (orange), and 10% (blue). The one- and two-sidereal-year aliases around each of the strongest signals are indicated by cyan and purple vertical solid lines, respectively.
Current usage metrics show cumulative count of Article Views (full-text article views including HTML views, PDF and ePub downloads, according to the available data) and Abstracts Views on Vision4Press platform.
Data correspond to usage on the plateform after 2015. The current usage metrics is available 48-96 hours after online publication and is updated daily on week days.
Initial download of the metrics may take a while.