Fig. 4
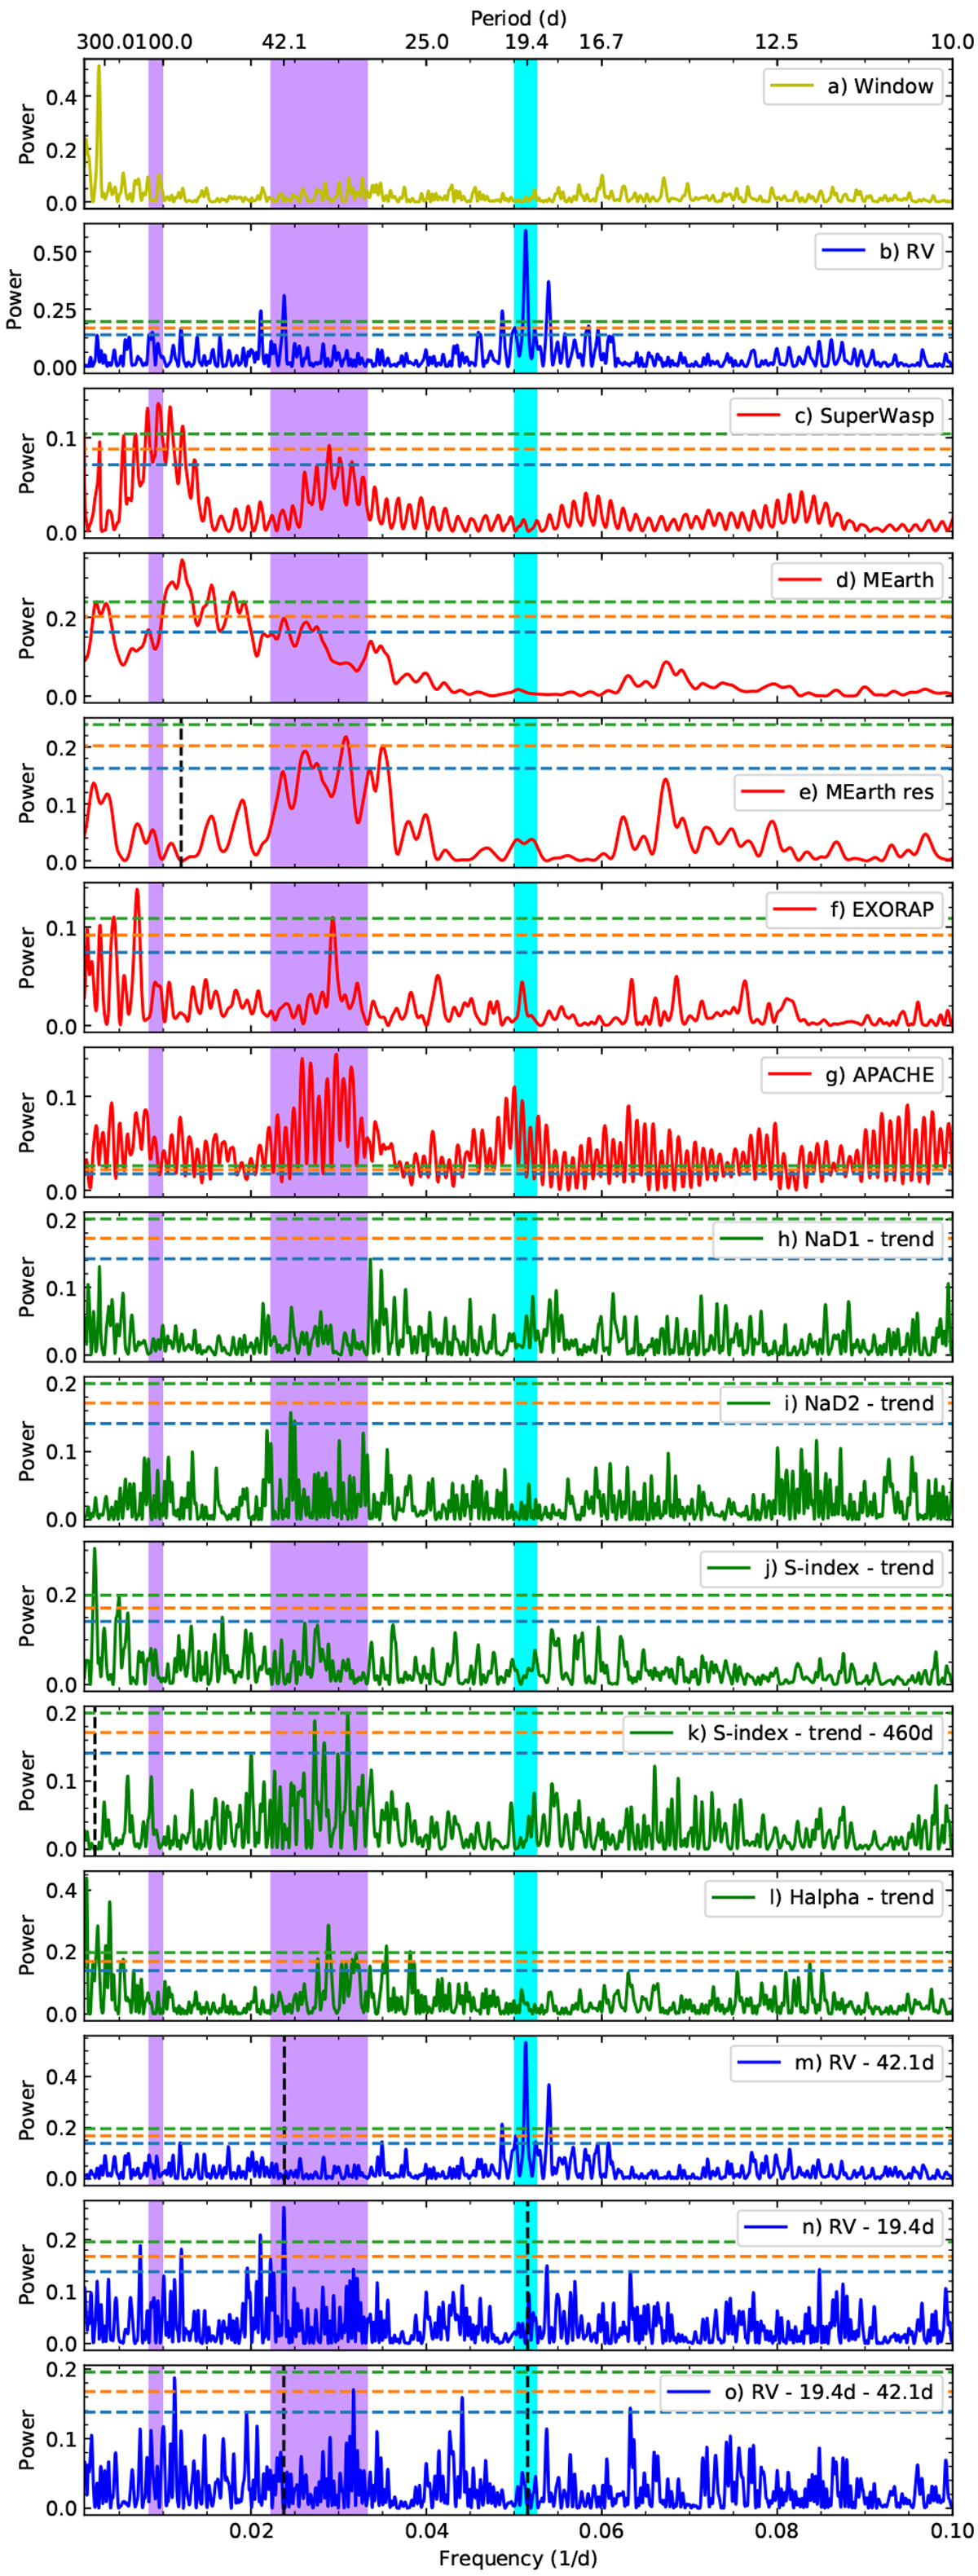
GLS periodograms for GJ 720 A RV data (blue solid lines), photospheric stellar activity (red solid lines), and spectroscopic stellar activity (green solid lines) in the frequency range 0.001–0.1 d−1 (1000–10 days in time range). In all the panels the horizontal dashed lines indicate FAP levels of 10% (blue), 1% (orange), and 0.1% (green). The shadowed areas indicate the region where the RV highest peaks are found. Panels a and b: spectral window (yellow line) and HARPS-N RVs (blue line), respectively. Panel c: SuperWASP binned photometric data. Panels d and e: MEarth binned photometric data and the residuals after removing the highest peak found at ~ 100 days (black vertical dashed line). Panel f: EXORAP B filter. Panel g: APACHE V filter binned photometric data. Panels h–l: HARPS-N NaD1, NaD2, Ca II H & K (S-index), and Hα HARPS-N spectroscopic activity indicators with a linear trend removed. Panel m: HARPS-N RV residuals after removing the 42.1 days signal, indicated as a black vertical dashed line. Panel n: HARPS-N RV residuals after removing the planet candidate signal at 19.5 days. Panel o: HARPS-N RV residuals after removing the 19.5 and 42.1 days signals. All the activity indicators and the RV data show a significant broad peak between 35 and 45 days. This is likely associated with the rotation period of GJ 720 A.
Current usage metrics show cumulative count of Article Views (full-text article views including HTML views, PDF and ePub downloads, according to the available data) and Abstracts Views on Vision4Press platform.
Data correspond to usage on the plateform after 2015. The current usage metrics is available 48-96 hours after online publication and is updated daily on week days.
Initial download of the metrics may take a while.