Fig. 14
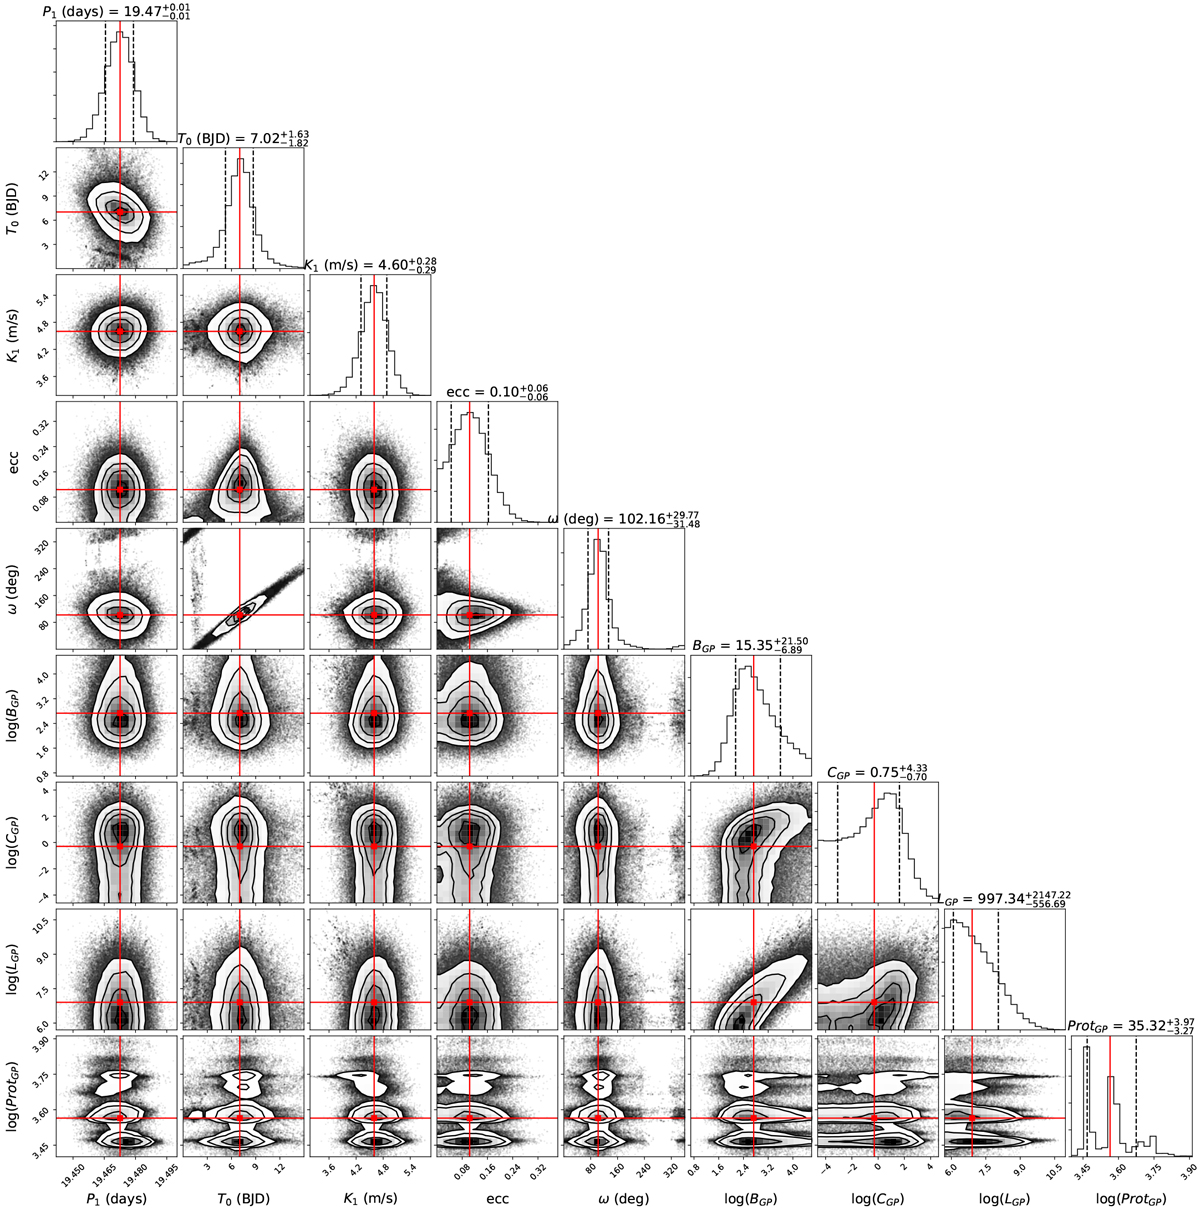
Posterior distribution of the BM + GP + 1pl model in which one sample from the chain over 100 is displayed. For ease of visualization, the offset and jitter parameters are not displayed. The median value of each parameter is plotted with a red line. The results were obtained using the emcee code. The log describing the GP parameters stands for neperian logarithm.
Current usage metrics show cumulative count of Article Views (full-text article views including HTML views, PDF and ePub downloads, according to the available data) and Abstracts Views on Vision4Press platform.
Data correspond to usage on the plateform after 2015. The current usage metrics is available 48-96 hours after online publication and is updated daily on week days.
Initial download of the metrics may take a while.