Fig. 12
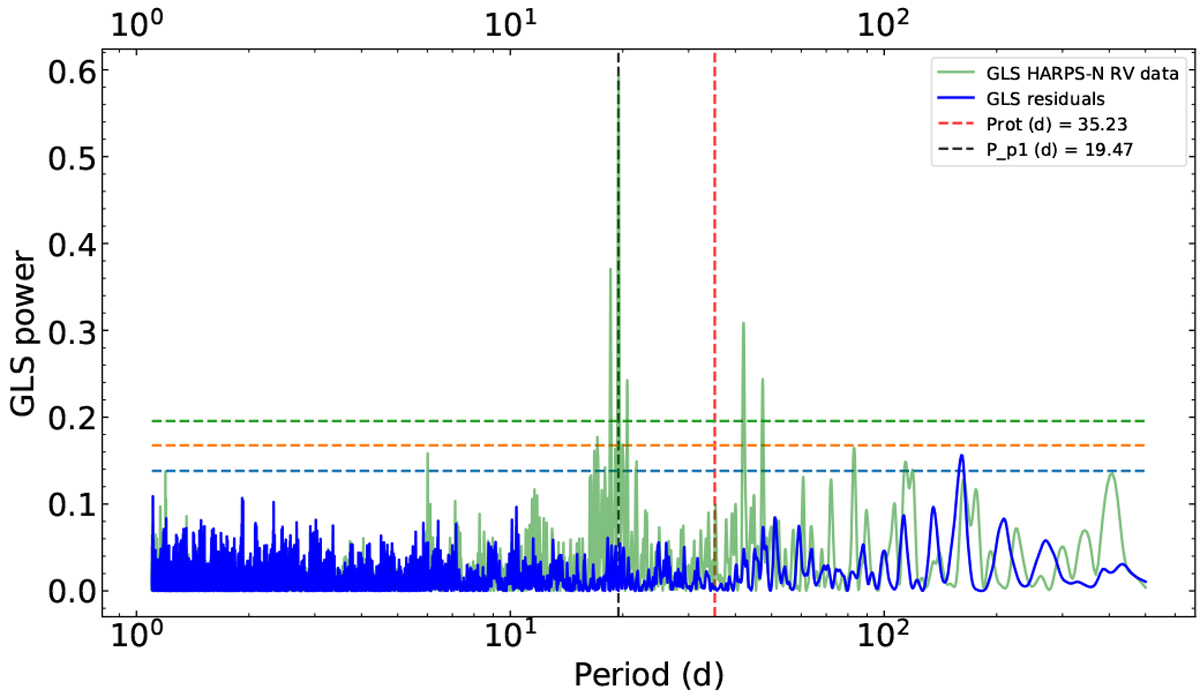
GLS periodograms of the RV data (green line) and the GLS of the residuals(blue line) after subtracting the best model of the RV stellar activity (Prot = 35.23 ± 0.11 days) and the Keplerian signal (19.466 ± 0.005 days) at the same time. The horizontal dashed lines indicate FAP levels of 10% (blue), 1% (orange), and 0.1% (green). The black and red vertical dashed lines indicate the orbital rotational period of the planet and the rotation period of the star, respectively.
Current usage metrics show cumulative count of Article Views (full-text article views including HTML views, PDF and ePub downloads, according to the available data) and Abstracts Views on Vision4Press platform.
Data correspond to usage on the plateform after 2015. The current usage metrics is available 48-96 hours after online publication and is updated daily on week days.
Initial download of the metrics may take a while.