Fig. 11
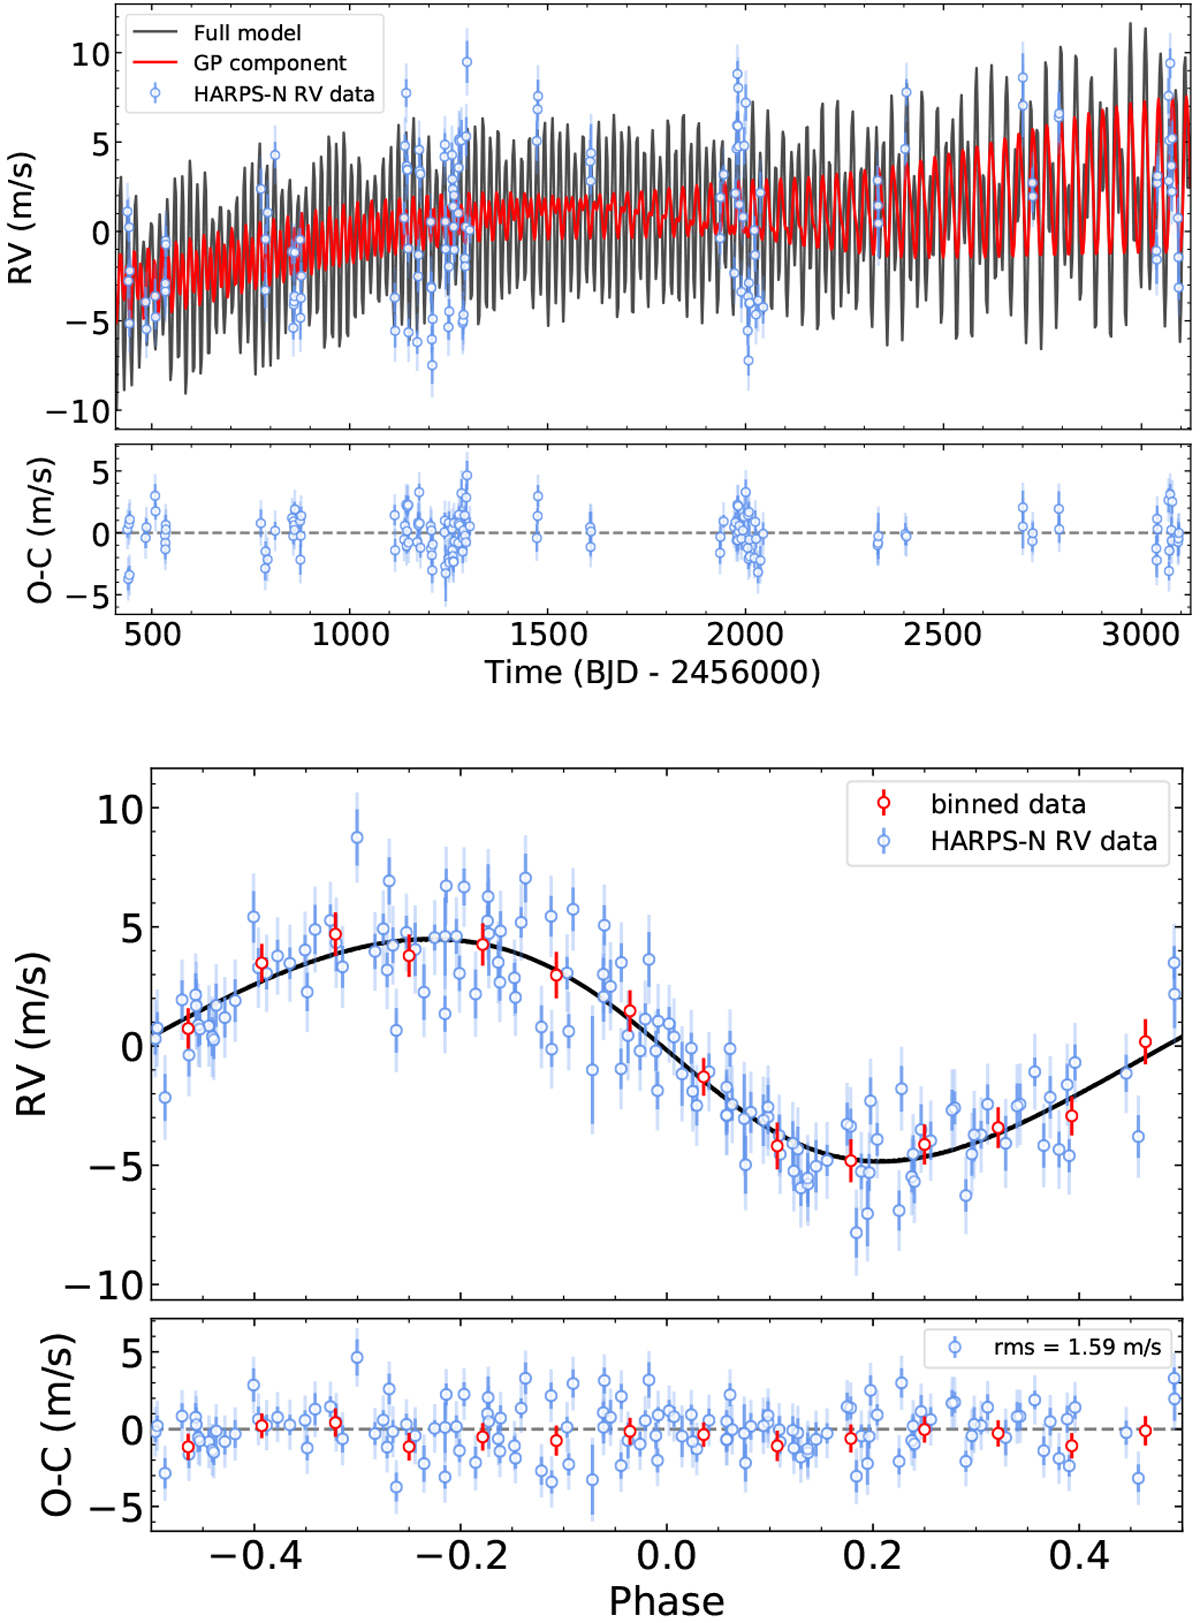
GJ 720 A CARMENES RVs. Top panel: RV time series (blue dots) together with the best model and the residuals. The fitted model (black line) corresponds to the base model plus an exp-sin-squared GP kernel that models the stellar activity at Prot =35.23 ± 0.11 days, and the planetary signal at 19.466 ± 0.005 days. The GP contribution is shown as the red line. The error bars (blue) include the RV jitter (light blue) taken into account. Bottom panel: RVs (blue dots) folded in phase (the base model and the stellar activity were removed) with the orbital period of the planet and its residuals. The best Keplerian solution (black line) has an RV amplitude of 4.72 ± 0.27 m s−1. The red dots correspond to the binned data. The rms of the residuals is 1.59 m s −1.
Current usage metrics show cumulative count of Article Views (full-text article views including HTML views, PDF and ePub downloads, according to the available data) and Abstracts Views on Vision4Press platform.
Data correspond to usage on the plateform after 2015. The current usage metrics is available 48-96 hours after online publication and is updated daily on week days.
Initial download of the metrics may take a while.