Fig. 10.
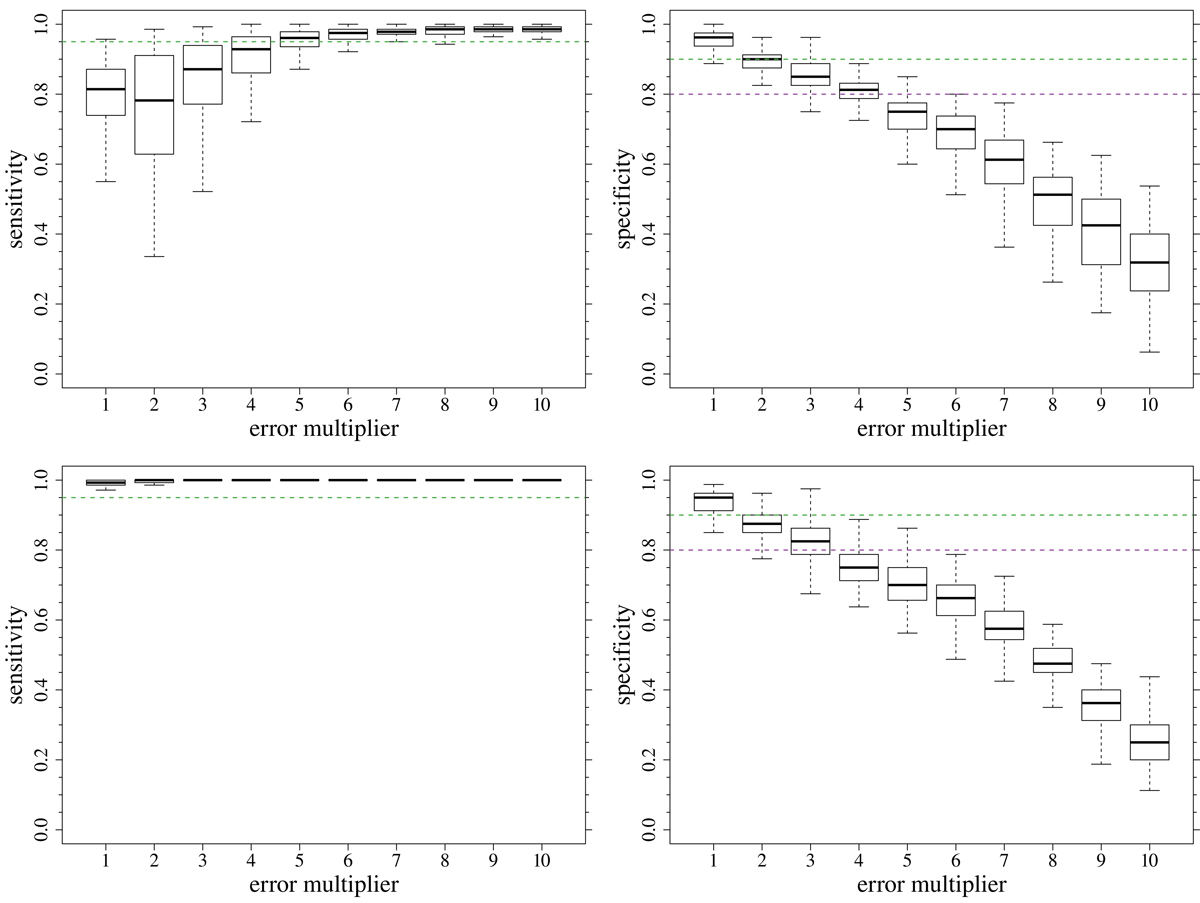
Top row, left panel: sensitivity for the detection of single stars from synthetic clusters as a function of the multiplier of the baseline observational error σ = 0.003 mag. The dashed line marks the 95% value. The cluster fiducial lines for the test were data driven (see text for details). Top row, right panel: specificity for the detection of single stars from synthetic clusters (data-driven fiducial line). The dashed green line marks the 90% value and represents a preferred target, while the purple line marks the 80% value and represents a minimum requirement. Bottom row: same as in the top row, but adopting the theoretical isochrone as the fiducial line.
Current usage metrics show cumulative count of Article Views (full-text article views including HTML views, PDF and ePub downloads, according to the available data) and Abstracts Views on Vision4Press platform.
Data correspond to usage on the plateform after 2015. The current usage metrics is available 48-96 hours after online publication and is updated daily on week days.
Initial download of the metrics may take a while.