Fig. 9.
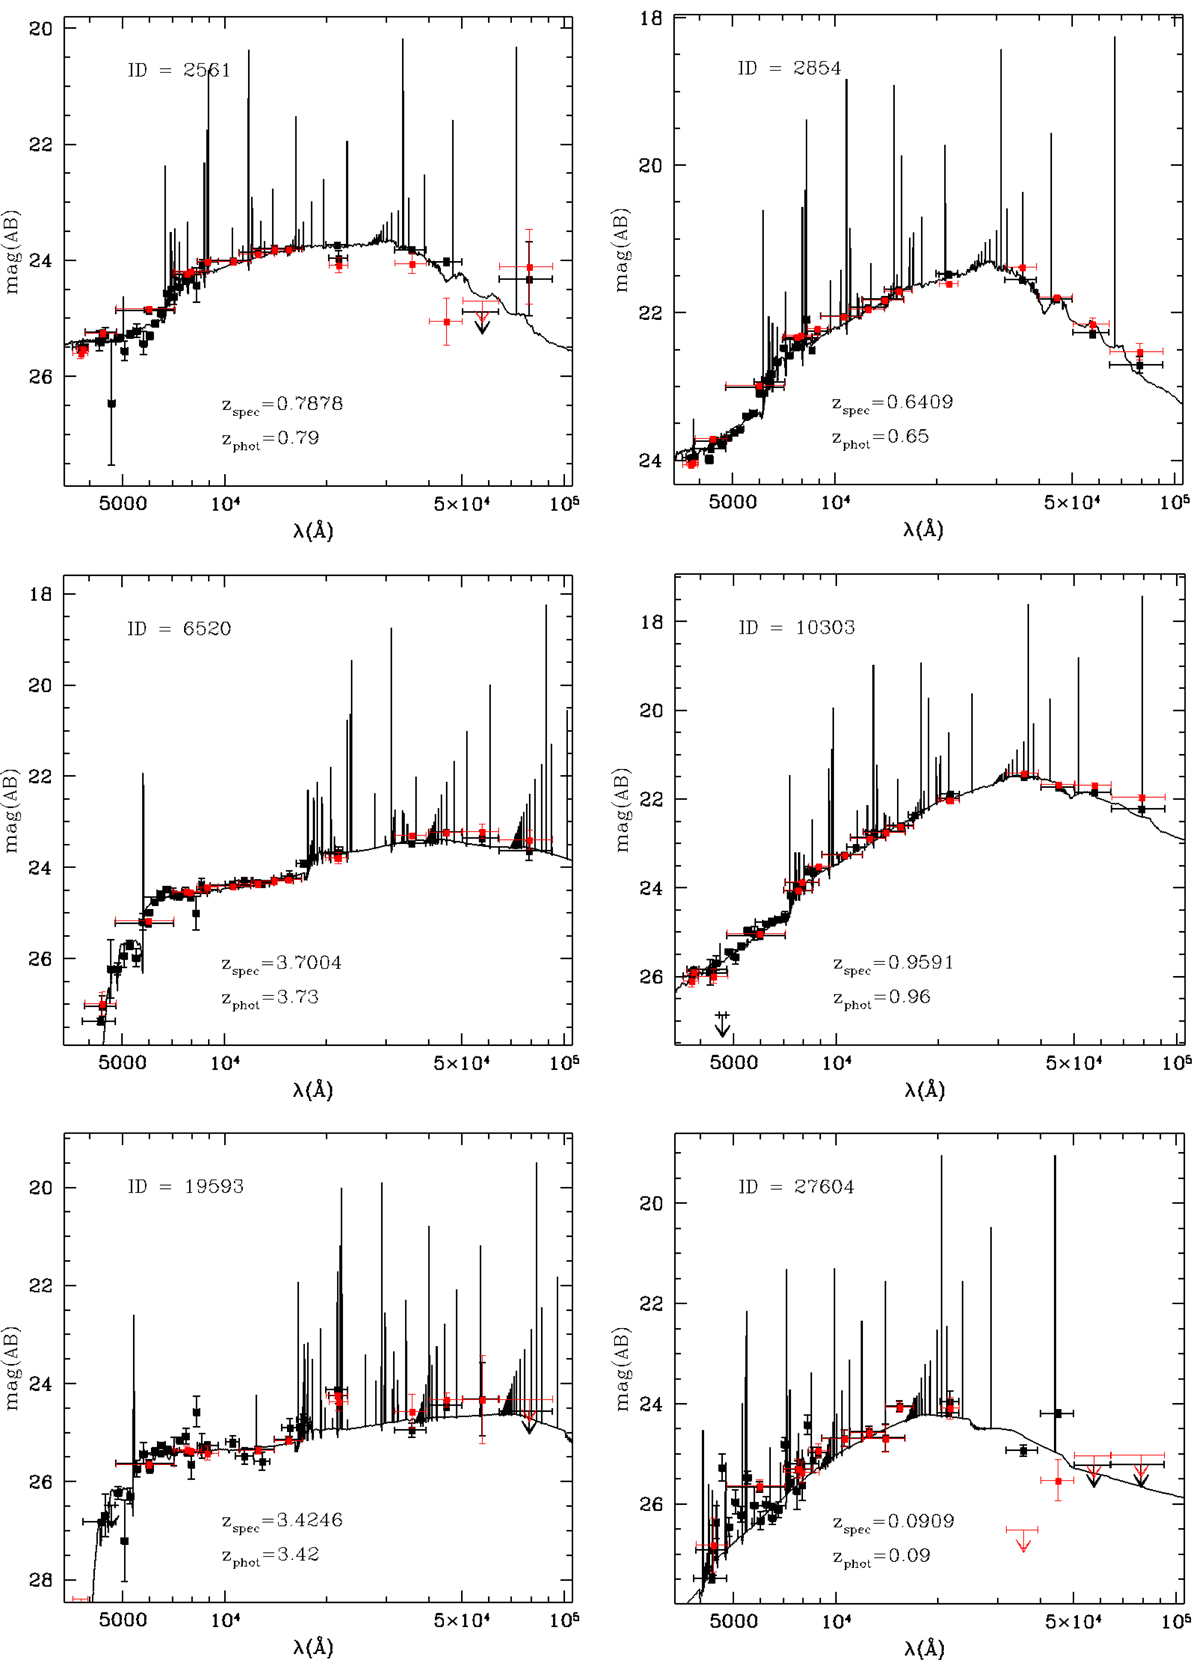
Six examples of SED fitting of photometric sources exploiting the full 43 band dataset. Red squares are the CANDELS photometry from G13, black squares are the new photometric measurements, and the solid line is the best-fit model for the redshift estimate. In these cases, the improved photometric coverage leads to enhanced accuracy in the fit and, consequently, in the photo-z estimates (reported in the plots) with respect to the CANDELS estimates. Globally, this yields an overall improvement in the accuracy of the photometric redshifts, as discussed in Sect. 5.3.2.
Current usage metrics show cumulative count of Article Views (full-text article views including HTML views, PDF and ePub downloads, according to the available data) and Abstracts Views on Vision4Press platform.
Data correspond to usage on the plateform after 2015. The current usage metrics is available 48-96 hours after online publication and is updated daily on week days.
Initial download of the metrics may take a while.