Fig. 8.
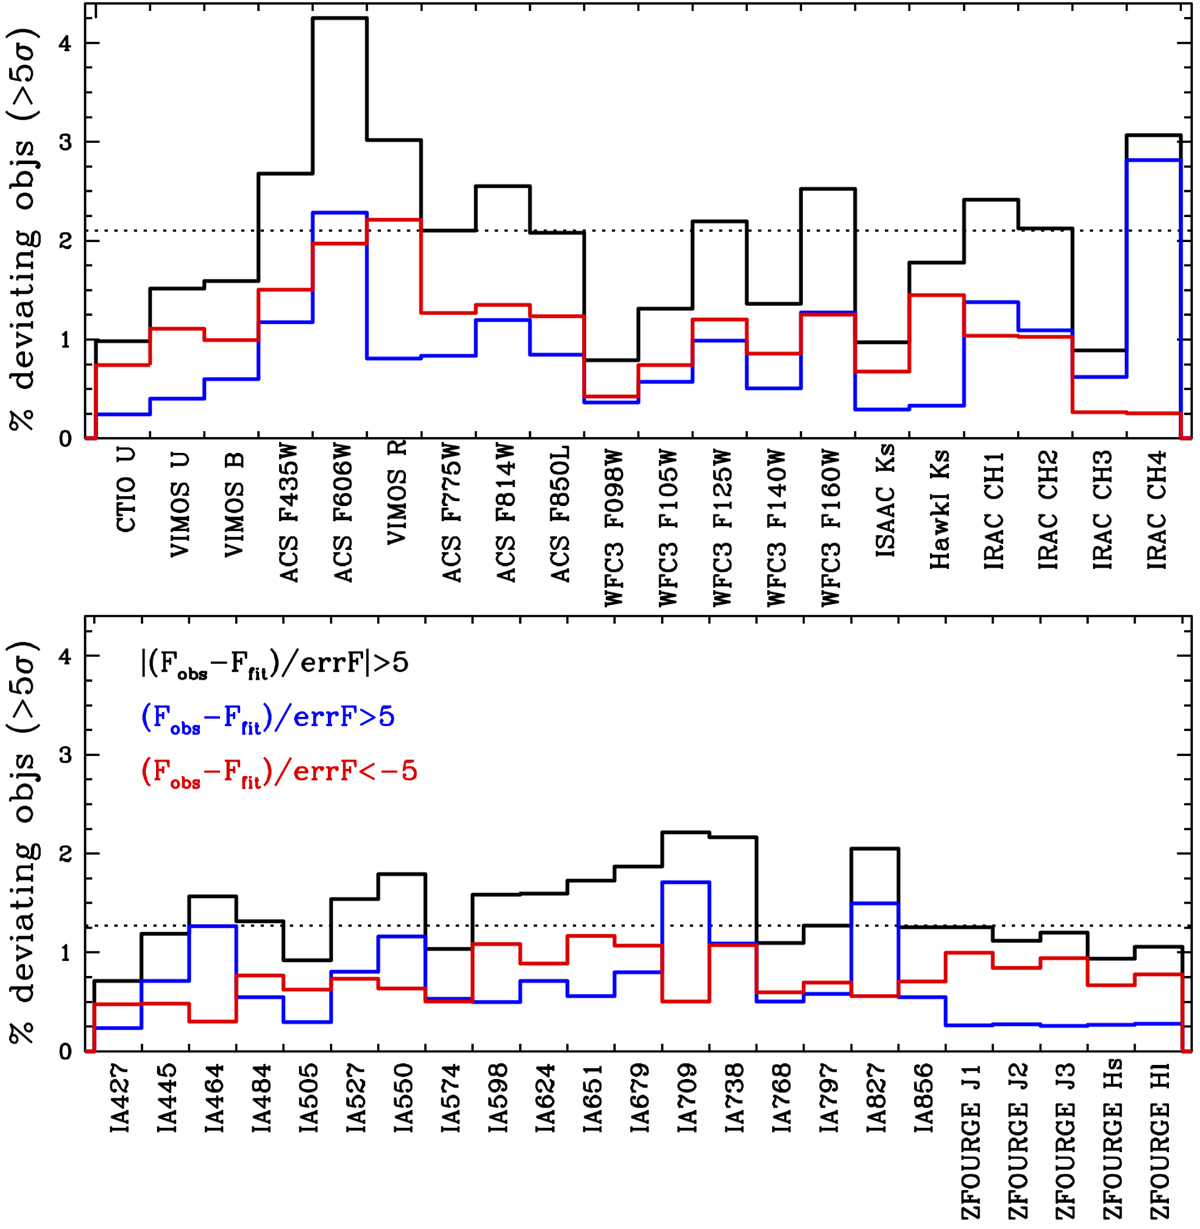
Percentage of objects whose photo-z best-fit flux in the Z-PHOT run for the estimation of the physical parameters deviates by more than 5σ from the observed one in any given band. Shown is the result for the τ model run; the results for the delayed τ models are very similar. Upper and lower panels: wide and medium bands, respectively. The total fraction of deviating objects is given by the black histogram, while the blue and red histograms show objects whose best fit underestimates or overestimates, respectively, the observed flux. The dotted horizontal line is the median value for the considered set of passbands (for the totals, these are 2.1% for the wide bands and 1.3% for the medium bands).
Current usage metrics show cumulative count of Article Views (full-text article views including HTML views, PDF and ePub downloads, according to the available data) and Abstracts Views on Vision4Press platform.
Data correspond to usage on the plateform after 2015. The current usage metrics is available 48-96 hours after online publication and is updated daily on week days.
Initial download of the metrics may take a while.