Fig. 5.
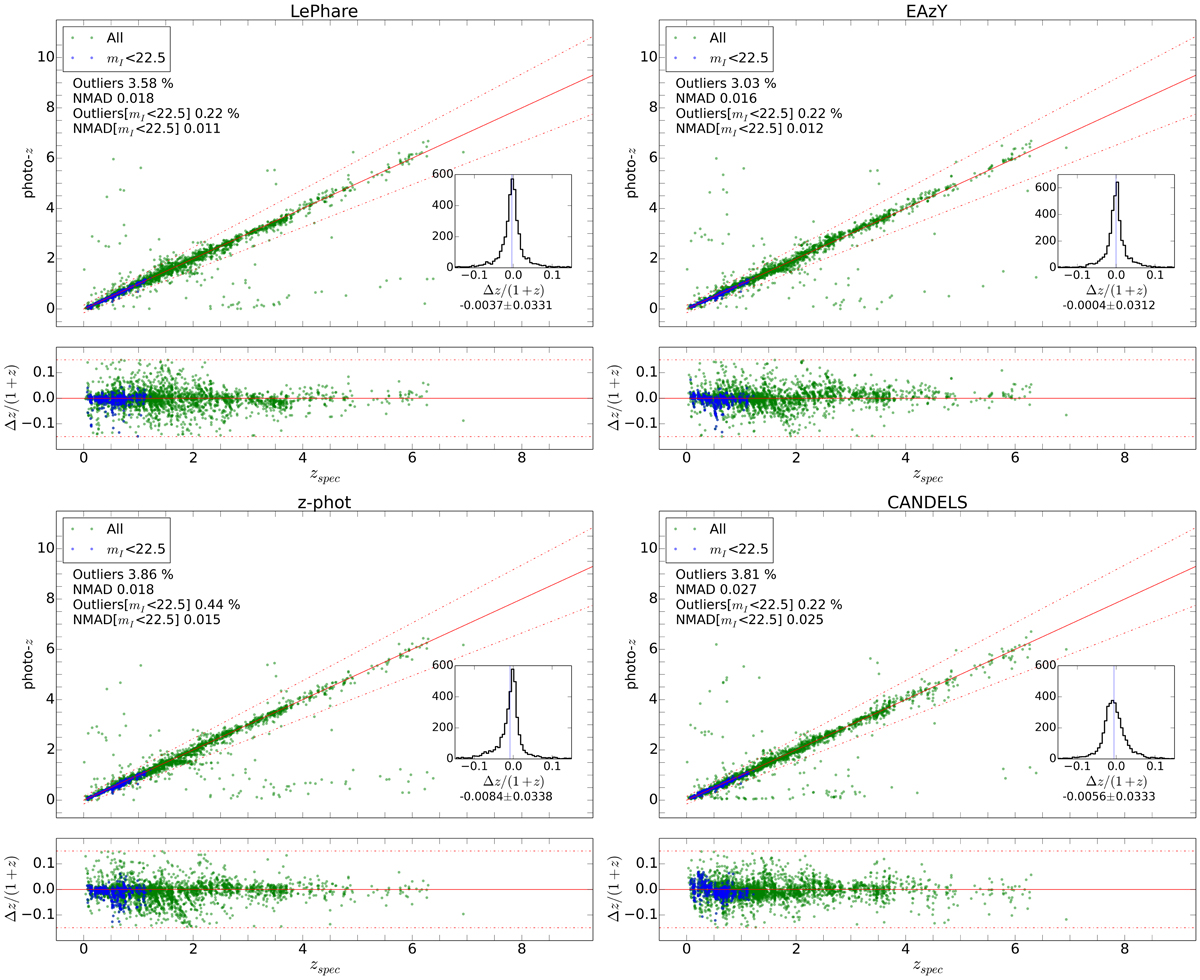
Comparison of photometric and spectroscopic redshifts for the runs of (from left to right, top to bottom) the three codes, LEPHARE, EAZY, and Z-PHOT, plus (bottom right panel) the official CANDELS estimates from Dahlen et al. (2013). Green points are the full sample of 3931 spectroscopic sources described in Sect. 5.3.1, while the blue points are the bright tail with I814 < 22.5. In each case, the top sub-panel directly shows photo-z vs. spec-z, while the bottom sub-panel shows the corresponding Δz/(1 + zspec) distribution; the small inner sub-panel in the bottom right corner also show the same quantity as a histogram, along with the values of the median and standard deviations. See the text for more details.
Current usage metrics show cumulative count of Article Views (full-text article views including HTML views, PDF and ePub downloads, according to the available data) and Abstracts Views on Vision4Press platform.
Data correspond to usage on the plateform after 2015. The current usage metrics is available 48-96 hours after online publication and is updated daily on week days.
Initial download of the metrics may take a while.