Fig. 11.
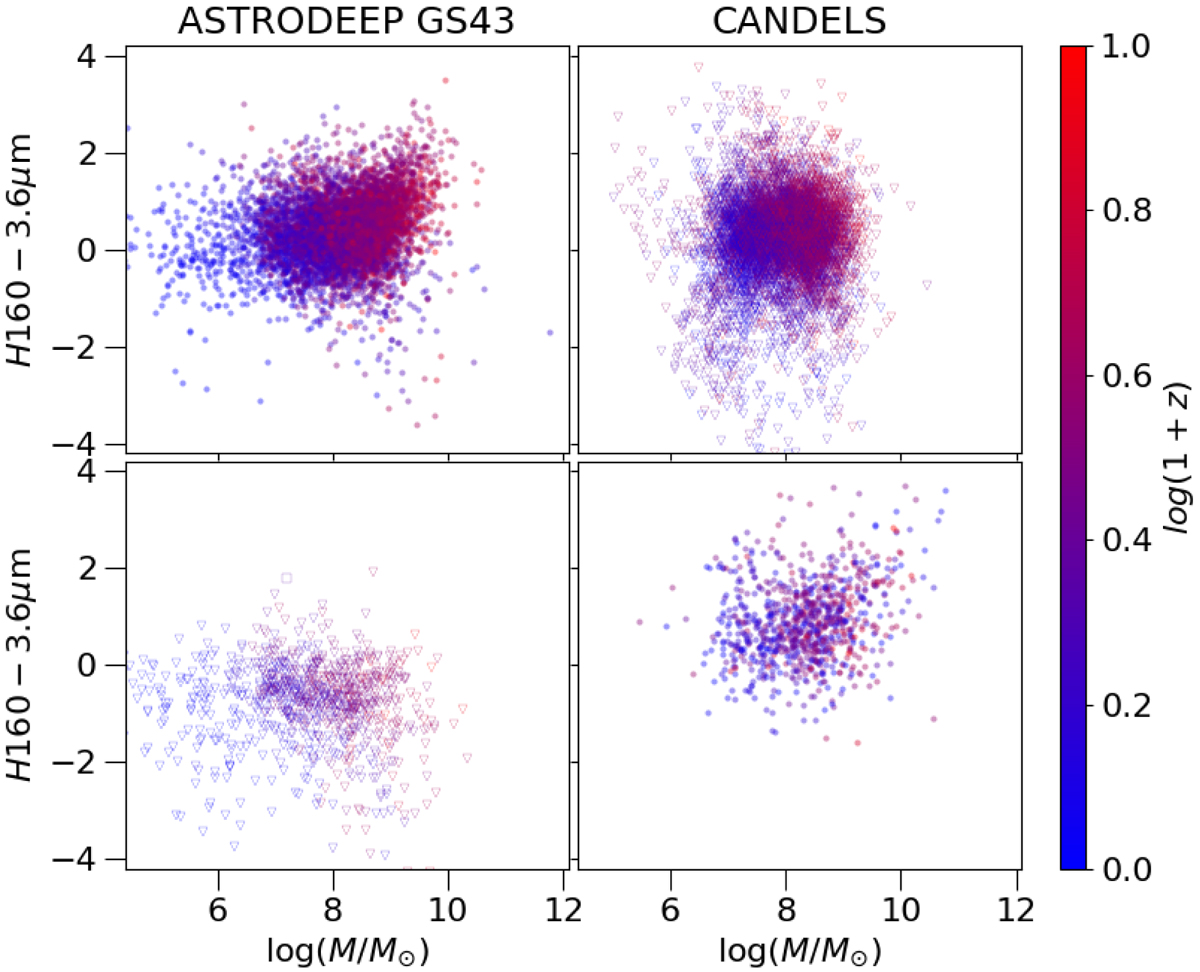
Compared colour-mass diagrams (H160−3.6 μm vs. stellar mass) of the GS43 and CANDELS catalogues, colour-coded as a function of redshift. Left panels: stellar mass and colour are from the GS43 catalogue; right panels: they are from CANDELS, with photometry from G13 and masses from Santini et al. (2015); in both cases we considered the standard τ models that include emission lines. Upper panels: sources that in GS43 are detected (S/N > 1) in IRAC CH1 and are upper limits in G13; the lower panels show the opposite.
Current usage metrics show cumulative count of Article Views (full-text article views including HTML views, PDF and ePub downloads, according to the available data) and Abstracts Views on Vision4Press platform.
Data correspond to usage on the plateform after 2015. The current usage metrics is available 48-96 hours after online publication and is updated daily on week days.
Initial download of the metrics may take a while.