Fig. C.7.
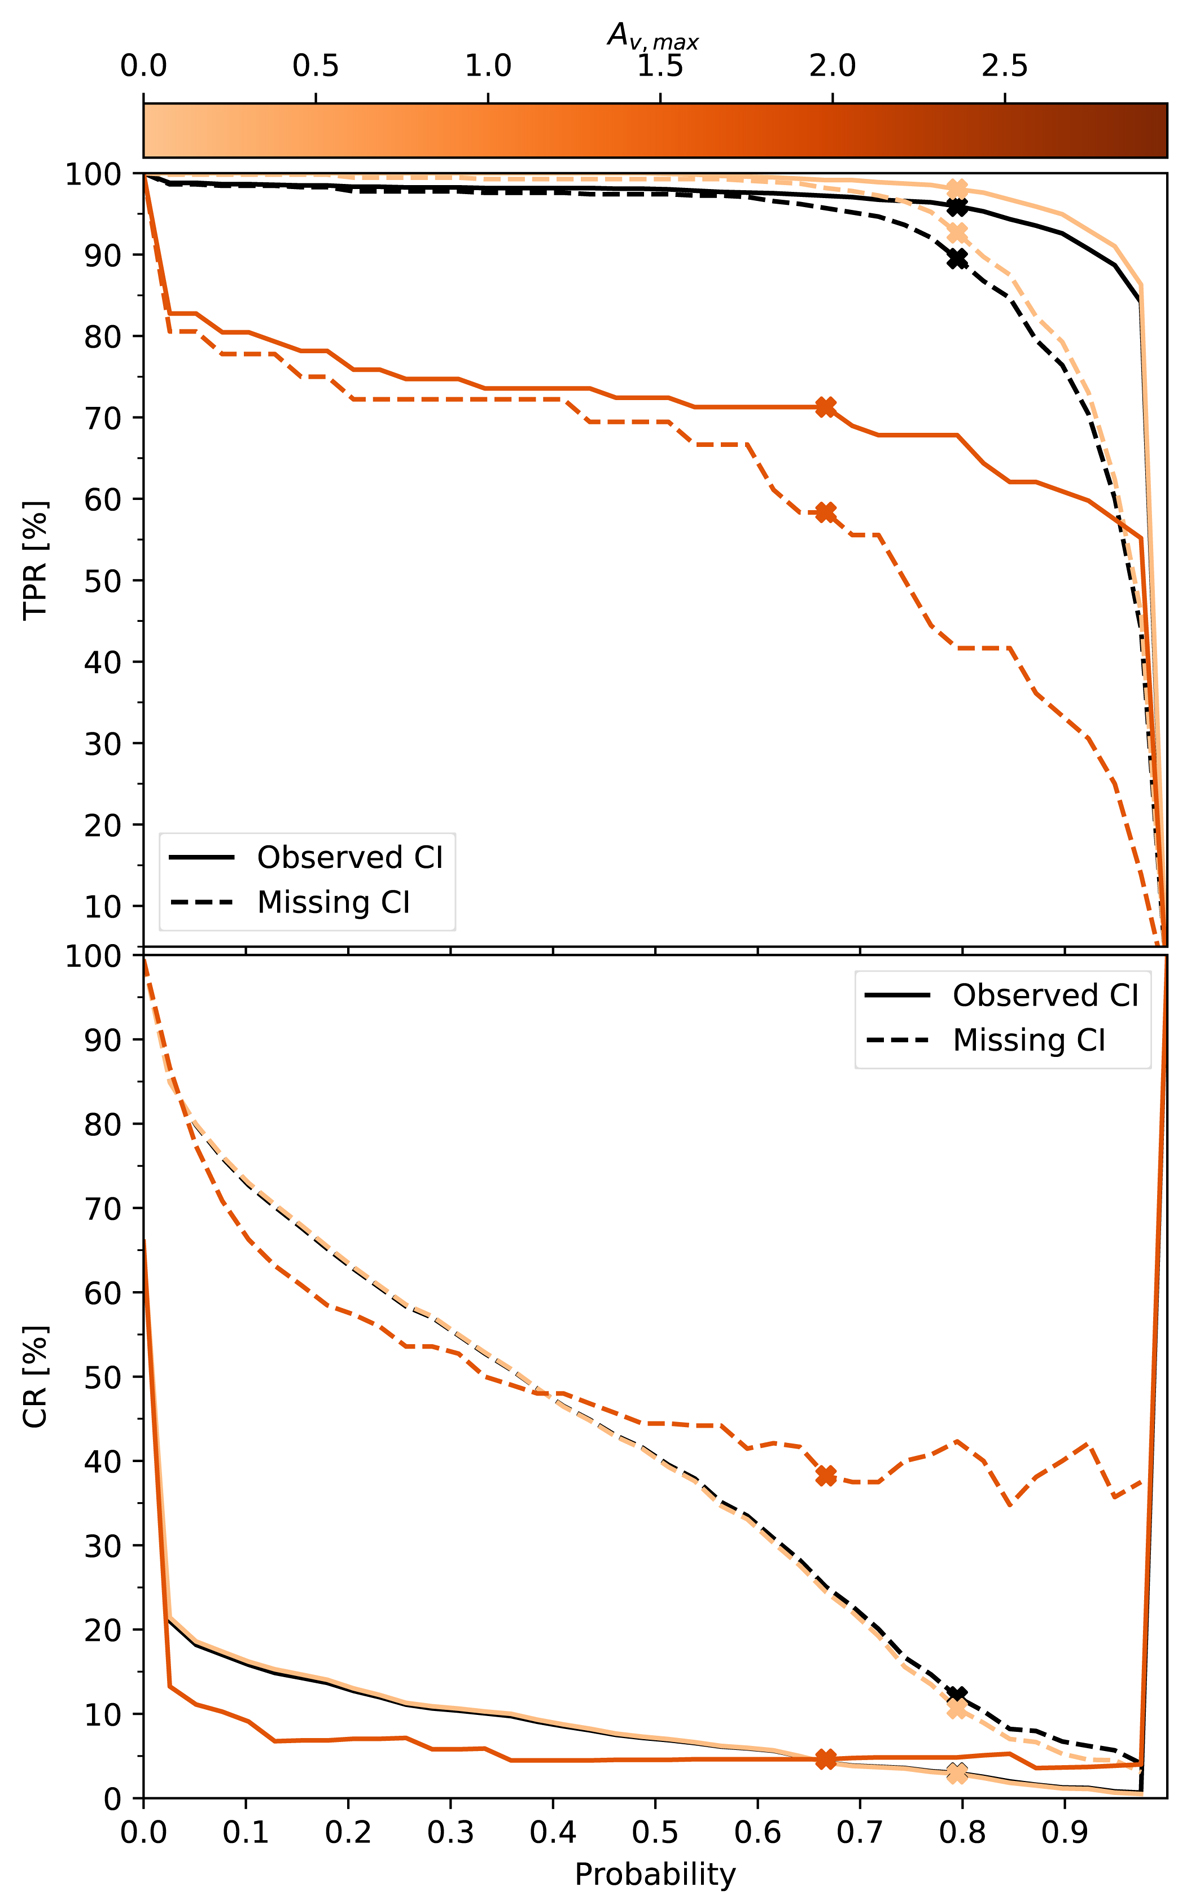
TPR and CR of the classifier resulting from the MAP0 data set. The sources are split into those with a missing (dashed lines) and observed (solid lines) color index. The black line indicates the results independent of the extinction value of the sources (i.e., the second strategy), while the colored lines show the results of different bins of extinction (i.e., the third strategy).
Current usage metrics show cumulative count of Article Views (full-text article views including HTML views, PDF and ePub downloads, according to the available data) and Abstracts Views on Vision4Press platform.
Data correspond to usage on the plateform after 2015. The current usage metrics is available 48-96 hours after online publication and is updated daily on week days.
Initial download of the metrics may take a while.